Glossary: Commonly used in Falkonry TSI
Alert Type
In Falkonry, "Alert Type" refers to the different categories or origins of notifications that the system can generate based on specific criteria being met within time series data. These alerts are designed to trigger actions and provide timely intelligence for operational efficiency and asset maintenance. Falkonry Rules can produce alerts based on threshold, anomaly detection, or patterns of interest
Anomaly-based alert
These are alerts based on anomaly detection. Falkonry's Insights feature automatically detects anomalies and generates anomaly scores. Rules can then be built on these anomaly scores. For example, an alert can be generated when any anomaly scores exceed a certain value (e.g., > 6) for a specified duration (e.g., 15 minutes). The latency for anomaly-based detection is defined by the sampling frequency, meaning slower data generally results in higher latency.
Condition-based alert
This is a broad category encompassing alerts triggered by specific operational conditions. Falkonry Rules are used to drive condition-based actions. This includes detecting operational conditions in real-time and reducing troubleshooting time. Examples include alerting when motor temperatures exceed a threshold or motor currents are high when the machine is operating. Falkonry's Time Series Intelligence (TSI) supports these alerts based on specific behaviors derived from any combination of signals in a no-code interface.
Pattern-based alert
These alerts are derived from Pattern recognition within Falkonry. The Patterns feature discovers meaningful temporal correlations and conditions, like early warning from multivariate Datastreams. Rules can be applied to the output of Patterns models to generate alerts. This typically has low latency, as pattern detection kicks in almost instantly once the data is processed.
Threshold-based alert
These are alerts based on threshold levels. They involve rules where alerts are primarily looking for a threshold-based criterion. For example, being alerted when motor temperatures are greater than 100 °F or motor currents exceed 100mA for more than 15 minutes. These types of rules can be applied to raw signals. Falkonry TSI supports these alerts without requiring programming capabilities.
Anomaly Score
An real-valued numerical output that measures how much a data point deviates from normal behavior, often by calculating the distance of its embedding from the mean embedding or by assessing the reconstruction error of a model trained on typical data. This score is like a Z-score for the embedding domain, where a higher score signifies a greater deviation.
Aperture
It is a concept similar to Window or "Observation Window", which refers to a trailing history of time series data that Falkonry examines to produce assessment outcomes. It is an input parameter to anomaly detection model building process in Falkonry Insights. e.g. An aperture of 60 minutes means the model considers 60 minutes of past data to compute the current anomaly score. For rules, it is called the "Evaluation Window".
Assessment
As an organization artifact
An Assessment is a data organizing construct within a Datastream. It is used to segregate events and models, allowing users to address specific purpose independent of other purposes. Assessments share signal data with others in a datastream, but maintain unique events, event groups, and models. It has unique events, event groups and models from all other assessments and may contains multiple AI/ML models, though only one can be active at a time for live output.
Also see Datastream
As a model output
An Assessment is an output produced by a Falkonry model that takes one or more input signals. The values within an Assessment represent the condition or state of an asset at a given point in time.
Also see Assessment Rate
Assessment Period
In Falkonry TSI an assessment period defines how and when a model or rule expression is evaluated. It includes two key parameters, namely Assessment Rate and Evaluation Window
Together, these determine how often insights or pattern detections are generated and how much historical context is considered for each assessment.
Also see Assessment Rate, Evaluation Window or Model Window Bounds, Lower Bound, Upper Bound, Sliding Window, and Tumbling Window
Calculations Transform
Assessment Settings (Calulations Transform)
Assessment Rate (Calculations Transform)
Assessment Rate is an assessment setting with Calculations Transform that determines the stride or frequency at which the Evaluation Window is applied. It defines how often the Python function is executed across the signal data.
- If the Assessment Rate equals the Evaluation Window, the transform uses a tumbling window (no overlap between windows).
- If the Assessment Rate is shorter than the Evaluation Window, it creates a sliding window with overlap.
Min-level
Min Level is an assessment setting with Calculations Transform that specifies the minimum level of granularity at which signal data is read and passed into the Python function. See table of levels
Model Parameters (Calculations Transform)
Evaluation Window Parameter (Calculations Transform)
The Evaluation Window defines the time duration of data used as input to the Calculations Transform's Python function. It determines how much signal data (from the Input Signal Set) is passed into the function during each evaluation cycle.
- For example, if the Evaluation Window is set to PT1S, the transform will process 1-second slices of signal data at a time.
- This parameter controls the temporal context for the transformation logic and is specified using ISO 8601 duration format (e.g., PT5M for 5 minutes, PT1S for 1 second).
Signal Sets
Signal Sets are named groupings of signals associated with a specific Calculation Transforms model. Each set represents either the input signals provided to the Python function within the Calculations Transform, or the output signals returned from it.
- The Input Signal Set includes all signals required by the transform model for computation.
- The Output Signal Set contains the resulting signals generated by the transform logic or API response.
- See signal ID section for details on what is stored in Signal Sets.
Statistic Parameter (Calculations Transform)
The Statistic parameter defines how data is read and aggregated at the set level before it is passed to the Python function. This determines the form of the signal data (e.g., average, min, max) used within each Evaluation Window.
- See Rule Statistic for more information.
Condition Override
A "Condition Override Function" is a feature that allows a user to manually suppress or replace the conditions detected by models with a user-defined condition. This is particularly useful during periods when normal alerting might be undesirable, such as when an asset is undergoing maintenance or during discrete processing where certain conditions outside of specific operational stages are not relevant. The function can use one or more "Controlling Signals" as input, which must be a subset of the signals originally used in the model's learning phase.
Conditional Variational Autoencoder (CVAE)
Falkonry's PatternIQ™ leverages a deep neural network architecture to learn multi-timescale embeddings for anomaly detection using a normalized reconstruction error.
Conditions
Conditions are what we are trying to extract from patterns found in time-series data. This is typically a measure of the state of some Entity. Conditions could be used to represent health, operating mode, risk or threat level, quality level, or almost any form of condition assessment.
Falkonry can also recognize two other conditions - Unknown and Gap:
Unknown
While a pipeline is monitoring the inflow or merely running a test revision, any new patterns that arise which were not seen when the pipeline was learning will be reported as the unknown condition. An unknown condition is displayed on the timeline alongside other condition labels. If a fact is added about that pattern, then Falkonry learns from it and replaces the unknown condition with the provided fact.
Signal Gap
This is a Falkonry system generated classification when a signal included in a model does not have data available for longer than the signal gap threshold. Note: Time periods shorter than the gap threshold will have signal data values filled in by interpolation or held at the last known value for that signal by TSI.
Note
Signal gap threshold may be set by API or via Falkonry Patterns UI
Also see Condition Label
Condition Model
A mathematical construct that converts signal data into assessment output. For example: a model converts a set of temperature and pressure values into a set of condition values (normal, fault, etc), explanation scores and confidence values. Falkonry condition models typically take data from a time window leading up to a point in time (assessment point) where it produces assessment output.
Unsupervised model
A model which produces assessments that express similarity between training data and target data but which does not use human classification of training data to perform this grouping. That is, the "shape" of the training data alone defines the groups into which target data will be classified.
'U1' through 'U10'
Falkonry machine generated assessment output condition labels (unlabeled1,...,unlabeled10) for patterns discovered during unsupervised learning.
Semi-supervised model
A model which produces assessments that express similarity between training data and target data in which some human (or external system) classification of training data is used to define groups. That is, a limited number of classified examples are used to define groups into which target data will be classified. If target data does not fit into a defined group, target data may still be clustered into unsupervised groups.
Supervised model
A model which produces assessments that express similarity between training data and target data in which all training data is classified by a human (or other system) in order to define groups. That is, all training examples are classified and are used to define groups into which target data will be classified. If target data does not fit into a defined group, target data may still be clustered into unsupervised groups.
Sliding-Window Model
A model in which assessments are separated by time rather than by event or signal. For example: a model which performs an assessment every 5 minutes would be a sliding window model.
Typically, if an asset is continuously operated & monitored and the condition could change continuously, it is generally suitable for the Sliding Window model approach.
Explicit-Window Model
A model in which assessments are separated by event or signal value rather than by time. For example: a model which performs an assessment after each weld is completed would be an explicit window model.
Examples include: chemical batch processing, welding, cutting of metal billets/ingots, fault traces of electrical equipment, wire bending, a single cycle of oil pump, semiconductor wafer processes, etc.
Activities that are discrete in nature and have well defined start / end markers along with fixed and repetitive windows / periods of operation are best characterized by Explicit windows.
X-Window models require an explicit window signal (not part of the model) that defines boundaries of the windows. In the explicit window signal a value change indicates a new explicit window. This could be a categorical signal or a numerical signal.
Charts
Charts in Falkonry TSI are an intuitive visualization tool for time series data, enabling users to quickly access and understand data. They provide a fluid, accurate, and responsive view of high-resolution time series data, including flags, measurements, and alarms, much like modern mapping technologies. This visualization allows for interactive analysis of results and helps engineers and operators diagnose issues, optimize performance, and enhance reliability
Connection
Connection in Falkonry TSI defines a data link between external systems and the platform. Connections can be Inbound or Outbound.
Inbound Connection
Inbound Connections bring time-series data into Falkonry from sources like Parquet/CSV files, MQTT, or Azure IoT. They support real-time and historical data and require signal approval before processing.
See more details here.
Outbound Connection
Outbound Connections push Falkonry-generated outputs (like rules-based alerts) to external systems using MQTT, Webhooks, or integrations with tools like Maximo, SAP Ariba, or Zapier.
See more details here.
Data
In the context of Falkonry TSI, data primarily refers to time series data, which is a time-varying sequence of data, often consisting of
Historical Data
This refers to time series data that is older than 4 hours. In Falkonry, historical data is typically used for model learning and evaluation purposes.
Live Data
This is real-time time series data flowing from manufacturing and production lines into Falkonry. It's used for live monitoring and real-time analysis, accelerating data-driven operations. Live data connections must be in a "PRODUCTION" status to ensure continuous processing. Falkonry supports various inbound connectivity options for live data, including AWS IoT Core, Azure IoT, File, iba Systems, Litmus, and MQTT. Live streamed data over MQTT is buffered for about 15 minutes before appearing on charts to balance processing cost and speed.
Data Gap
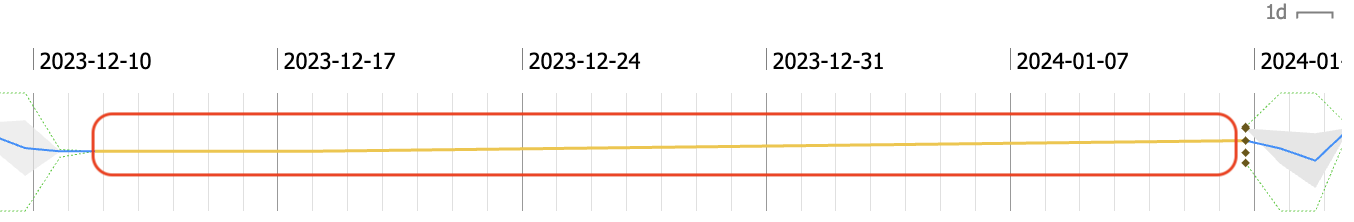
A period of missing values within a signal's data. The TSI visually connects the two nearest data points on either side of the gap with a yellow line. Falkonry can accommodate data with gaps. If an approved numeric signal inadvertently receives categorical values, these non-numeric data points are silently dropped, resulting in a data gap. A gapThreshold property can be configured to define an interval that should be treated as a data gap, causing the last known value to be repeated until this interval is met
Also see Signal gap
Datastreams
A Datastream in Falkonry is a data organizing construct that consists of all elements needed for modeling, namely signals, signal groups, entities, assessments, models, events, evaluations, and model output. A Datastream has one or more Assessments.
Users of Falkonry Patterns may have multiple Datastreams of their choice. However, Falkonry Insights, Rules & Calculations Transforms internally use a dedicated Datastream for processing the data.
Insights Datastream
A special (hidden) Datastream named Anomaly Signal Datastream with ID: 000000001 is used for managing anomaly detection models. Every monitored Signal has its own dedicated assessment.
Rules Datastream
A special (hidden) Datastream named Rule Signal Datastream with ID: 000000002 is used for managing rules models. Every monitored Rule has its own dedicated assessment.
Calculations Transform Datastream
A special (hidden) Datastream named Calculated Signal Datastream with ID: 000000003 is used for managing custom calculation models. Every monitored Calculations Transform has its own dedicated assessment.
Also see Assessment
Derivative Signal
Time series signal(s) derived from the values of other existing signal(s)
Evaluation
The process of applying a model to a set of target data to genearte the assessment output for the same duration of target data. During this process the system also calculates a number of properties of the assessment output for that same target data. The properties include:
Agreement
The proportion of times the model's predicted condition matches the actual (ground truth) condition, reflecting how often the model is correct across all classes. It is calculated as the sum of true positives for all classes divided by the total number of predictions.
Condition Distribution
Condition distribution refers to the percentage of occurrences of each condition within the evaluation range of a model. For example: - In an unsupervised model, a higher distribution percentage for a particular condition indicates that it is more prominent and likely represents a normal operating behavior. - For a supervised model, analyzing the distribution percentage of a specific condition, such as "warnings," can help in reducing false positives when the model is operational
Evaluation Window
The duration of data used for each evaluation (e.g., past 1 hour)
Also see Evaluation Window (Rules) and Evaluation Window (Calculations Transform)
F-Measure
The harmonic mean of recall and precision. A higher F-measure indicates that both precision and recall were higher. In many applications it is necessary to trade off recall for precision (or vice versa). It is important to understand the application in order to decide whether precision, recall or a balance of both is required for the use case to be successfully resolved. That is, a higher F-score isn't always better.
Precision
Fraction of what was predicted that was classified correctly (false positives do count against precision). Higher precision → higher probability that when you say something is an X it really is an X. High precision is important in applications which cannot tolerate false positives.
Recall
Fraction of what is actually a certain class that you classified correctly (false positives don\'t count against recall).
Higher recall → higher probability that you classified as X all of the things that are actually X, even if many of the things you called X are incorrectly classified. High recall is important in applications which cannot tolerate false negatives.
Running an evaluation is required to apply a model to a new set of target data. Creating an episode will also cause an evaluation to occur on the time period that the episode spans. However, performing an evaluation will not automatically create an episode.
Entity Group
Entity group is a label that groups multiple entities to each other (e.g., "pump 1", "pump 2" could be grouped as _pumps). It is a best practice to define signal groups to isolate reference and model signals.
Event
A labeled interval of time with a defined start and end time. In addition to visualizing the events on a signal chart, user may also use it for:
Condition Label
A condition label is a name assigned to a specific period of time that describes the state or behavior of an entity. These labels represent known conditions such as "healthy," "fault," "normal," "warning," "stopped", etc.
In Falkonry Patterns, condition labels:
- Are often referred to as "Facts" when provided by users to train supervised and semi-supervised models, providing feedback to the condition recognition engine.
- Can be machine-generated by unsupervised models (e.g., 'U1' through 'U10') for discovered patterns or as "unknown" for newly encountered, unclassified patterns.
Each condition label gets a unique color as a user preference in the account.
Also see Conditions, Labeling best practices
Evaluation range
An Evaluation Range refers to a specific time range or validation region that is used to assess the performance of a model after it has been created. While not strictly required for model creation, it is considered a good practice to define an evaluation range to check if pattern identification is as expected, especially over known failure regions.
Also see Evaluation
Exclusion range
An Exclusion range (or Exclusion Group) refers to specific time periods that are intentionally excluded from a model's learning process. When creating a model, users can select event groups to define time ranges that should be left out of model training. This practice helps ensure the AI/ML model learns from "known-good" data and avoids being influenced by periods with irrelevant behavior, known issues, or data quality problems
Inclusion range
An Inclusion range, also referred to as Inclusion Groups, defines the specific time periods or data segments that are explicitly selected and used for a model's learning process. It is typically a required component for model creation.
These ranges are often represented by Event Groups and are crucial for teaching the AI/ML model about the "normal" or expected behaviors of the system. By providing these specific timeframes, the model learns from data where the behavior is considered typical or "known-good"
Learning (or Training) range
The learning range is a crucial concept, especially when developing AI models like Insights or Patterns. It refers to a time range where data behavior is considered "normal" operation. This range is always required for model creation and should encapsulate all expected normal behaviors. Sometimes this is referred to as "training range" or "training period".
Also see best practices around defining learning range
Event Group
A label which relates multiple events to each other. For example: A "pump failures" event group label could be applied to all the specific event instances where the pump failed. A single event may belong to multiple event groups.
Also see Event)
Facts
Facts are known conditions for a specific period of time that are used as labels to train a model. They can originate from external sources, inspection reports, or investigations. When used as inputs for a model, they are specifically referred to as 'Facts'. They serve to provide labels for semi-supervised and supervised learning. While Falkonry doesn't require a minimum number of facts, using at least two types of events is suggested to prevent over-generalization. It is important to note that Falkonry strongly advises against using facts for "Problem Events" or obvious operational abnormalities, as this can obscure the model's ability to identify "warning" and "normal" conditions
Featurization
In the context of Generalization Factor within Falkonry Patterns' Condition model hyperparameters, featurization refers to the system's inherent ability to analyze the general shape of time series patterns, making it less sensitive to minor temporal shifts or small peaks and troughs when maximum feneralization is applied. Importantly, TSI is designed to operate without requiring manual feature engineering, leveraging its PatternIQ™ technology to learn multi-timescale embeddings that capture common shapes, waveforms, and value distributions for anomaly detection.
Good Signal
A “good signal” in Falkonry TSI is numeric, high-quality, consistently sampled, and free of source-side compression or gaps. It should be relevant for monitoring, uniquely named, enriched with metadata, and organized in trees. Avoid flat, counter, or redundant signals.
Also see Signals, Signal characteristics, and Signal metadata
Heatmap
A visualization tool in the Insights Dashboard & Reports that highlights periods and signals of unusual behavior. It represents deviations from normal operation with a color gradient from green to yellow for unexpected behavior and yellow for significant deviations. Purple indicates normal operations.

Live Monitoring
Once the model training is complete, deploying the model to accept real time data as input and to produce assessment output for that data is Live Monitoring.
Model
A model in Falkonry TSI is a mathematical construct or AI/ML algorithm that learns from time series data to discover patterns and conditions. It captures mappings from inputs like signals, historical data, and user-provided facts condition labels, to assessment outputs. Models are designed to understand the state of a system.
Model Hyper-Parameters
Condition Override
Condition override is a modeling option that allows a specific input signal to suppress or override the model’s output during defined periods, typically by introducing a signal gap (i.e., null or missing values). This mechanism is used to prevent model inference or alerting when the system is in a known, valid state where fault detection is unnecessary — such as when a machine is powered off, idle, or undergoing expected downtime.
Condition override is particularly useful for improving model reliability and interpretability by:
-
Reducing false positives during “off” or inactive states
-
Avoiding the need to explicitly model or classify normal machine shutdown periods
-
Streamlining fault detection models by excluding irrelevant time periods from training and inference
Generalization factor
A float value between 0.0 and 1.0 which is used to set a threshold that the model's confidence value needs to exceed in order to assign a condition to that assessment. This occurs in two stages for Falkonry models. The first stage applies to supervised/semi-supervised model output. If the supervised assessment's confidence value exceeds (1-GF) then the supervised model's condition assessment (i.e. a classification) will be applied. If not, then the second stage is checked.
The second stage applies to the unsupervised model output. If the unsupervised assessment's confidence value exceeds (1-GF) then the unsupervised model's condition assessment (i.e. an unsupervised group label) will be applied. If not, then the assessment will be labeled as "unknown." With Generalization value \< 0.5, Falkonry matches the supplied fact patterns increasingly restrictively. With values closer to 0.0 the patterns that are slightly different from learned patterns are classified as "unknown"
With Generalization value >= 0.5, Falkonry matches the fact patterns increasingly approximately (generally). With value of 1.0 every pattern is classified into one of the supplied fact classifications Unknown
When Falkonry discovers a pattern in the target data being assessed that is not sufficiently similar to examples in the trained data set, an
unknown label is assigned. See "generalization factor" for more details of how "sufficiently similar" is defined.
unknown patterns could be an anomaly or a new condition. For Falkonry to recognize and label unknowns properly in the future, the
data associated with an \'unknown\' pattern should be included in the training set of the next iteration of the model.
Model window bounds
Model Window Bounds (for Sliding Window Models): For Sliding Window Models, the Lower Bound and Upper Bound serve as guidance for Falkonry Patterns to automatically select a suitable trailing historical window for each signal during the model learning process.
These window bounds are critical in forming the feature vectors that enable pattern discovery and condition detection within the model. Adjusting these bounds is part of the iterative process of refining models
Time window lower bound
The Lower Bound should ideally span the duration of the smallest behavior or event of interest within the asset. It is recommended that this lower bound includes at least 10 or more sample points of your signal to ensure effective feature vector derivation.
Time window upper bound
The Upper Bound should encompass the longest event or behavior of the asset. If this is unknown, a good guideline is to set the upper bound at 6 to 10 times the size of the lower bound window.
Cluster guidance
Cluster guidance is a parameter within Falkonry's model settings that allows a user to specify or influence the number of distinct behaviors or groupings (clusters) that the AI/ML model should identify in the time series data.
This setting helps control how many unique patterns Falkonry's unsupervised models classify, ranging from 'U1' to 'U10'. While you can manually set this number, it is generally recommended to keep the cluster parameter selection at its default unless you have a specific understanding of the signal behavior you are modeling for.
Assessment rate
This is the rate at which a model creates its output. Default is 1/4 of the window size. It is generally system determined but in Patterns, there is a way for the user to specify it in the model hyper-parameters.
Model of Models
A Model of Models is a model that uses the assessment output of another model as its signal input. This is also known as a "chained model". This capability is made possible because Falkonry's assessment outputs (which include conditions) are stored as signals, allowing them to be subsequently used as inputs for other models
MQTT (Message Queue Telemetry Transport)
Publish-subscribe-based messaging protocol, standardized by the OASIS technical committee, which is used to communicate device data. It is often used when a very large network of small devices needs to be monitored or managed via the Internet e.g. parking sensors, underwater lines, energy grid, etc. The messages are encapsulated in several predefined control packets, which are designed to minimize the network footprint. Widely adopted standard. Good for server-to-server and server-to-client communication.
Also see Connections
Reconstruction Error
Falkonry's PatternIQ™ uses a normalized reconstruction error to perform anomaly detection, providing a unified comparison scale across various sensor data.
Rule
A Rule in Falkonry TSI is a set of criteria applied to one or more signals to generate a True or False assessment. Rules are automatically evaluated by Falkonry as data becomes available and can optionally generate Alerts to track and notify users of important events.
Simple Rule
A Simple Rule is based on a logical test applied to one or more signals. e.g. current > 16.8. These are direct comparisons that evaluate a signal’s value over a window of time.
Raw threshold rule
It uses one or more user-provided signals that triggers an alert when a value of input signals cross a predefined numeric threshold (either above or below). Such a rule is ideal for well-understood operating limits like temperature, current, pressure, vibration, etc.
Insights rule
It uses one or more Falkonry AI-generated /anomaly score signals to trigger alerts when one or more scores exceed a defined threshold - indicating a significant deviation from normal learned behavior. Unlike static thresholds, Insights Rules dynamically detect unusual patterns, waveforms, or trends, making them ideal for uncovering subtle or unexpected changes in equipment performance across a complex system.
Patterns rule
It uses one or more Falkonry AI-generated /predictions signals - outputs of a trained multivariate model that detects specific operating conditions or behaviors across multiple signals. It triggers alerts when the system identifies a pattern that matches a learned condition (e.g., a warning mode or a Problem Event). Patterns Rules are especially effective for detecting complex, concurrent behaviors that cannot be identified through individual signals or simple threshold-based logic.
Compound Rule
It uses one or more Falkonry generated /rule signals - outputs of other Rules - allowing for more complex conditional alerts. This enables detection of more nuanced situations by capturing relationships between multiple signals or events. For instance, alerting on high motor current only when the system is running.
Rule Configuration
Every rule is configured, in a no-code environment, with the criteria of choice. Rule configuration involves defining:
Signals
Rules can use one or more signals from various sources, including User Provided (raw numeric or categorical data), outputs from Insights (/anomaly scores), Patterns (/predictions, /confidences, /Explanations-), or outputs from other Rules (/rule or /alert). All signals within a single rule must be of the same type (either all numeric or all categorical). Up to 100 signals can be added to a rule.
Rule Statistic
Depending on the data rate of the input signals to a rule and the size of the evaluation window, a rule may be assessed with raw signal values or aggregations of signal values. The rule statistic determines which aggregation of data will be used, when necessary.
- Rule statistic options:
-
- Mean: Assesses the rule using the average value of a signal for a given period of time.
- Min: Assesses the rule using the minimum value of a signal for a given period of time.
- Max: Assesses the rule using the maximum value of a signal for a given period of time.
Rule Condition
The mathematical expression which determines what kinds of signal behaviors will result in a True assessment of a rule.
- Rule condition options:
-
- Greater than > : Causes a rule assessment to be True when the signal value is greater than the rule value.
- Greater than or equal to >= : Causes a rule assessment to be True when the signal value is greater than or equal to the rule value.
- Less than \< : Causes a rule assessment to be True when the signal value is less than the rule value.
- Less than or equal to \<= : Causes a rule assessment to be True when the signal value is less than or equal to than the rule value.
- Equals = : Causes a rule assessment to be True when the signal value exactly equals the rule value.
- Does not equal != : Causes a rule assessment to be True when the signal value is any value except the rule value.
Rule Value
The numeric value or categorical label which will be used, along with the rule condition, to assess the rule threshold.
Evaluation Window (Rules)
The window of time for which the rule threshold will be assessed. The evaluation window is a sliding window, which means that as rules are periodically assessed, the evaluation windows will overlap.
As you configure a rule, the evaluation window will help you tune how long a behavior should continue before it is noteworthy. Some behaviors may happen quickly, implying a shorter evaluation window, whereas other behaviors may only be noteworthy if they continue for some time, implying a longer evaluation window.
Density
The density setting will determine the percentage of the evaluation window for which the rule condition must be satisfied to trigger the rule and generate a True assessment. The period of time which meets the rule threshold does not need to be continuous.
- Examples:
-
- If the evaluation window is 10 minutes, and the density setting is 20%, then a rule will generate a True assessment if 2 minutes across the 10 minute evaluation window meet the rule threshold.
- If the evaluation window is 10 minutes, and the density setting is 100%, then a rule will generate a True assessment if the rule threshold is met for the entire 10 minute evaluation window.
Coverage
The coverage setting only applies to rules with more than 1 input signal. When a rule has more than 1 input signal, the coverage setting determines the number of input signals which must meet the rule threshold in a specific evaluation window to generate a True assessment.
All input signals to a rule share evaluation windows, but each signal is evaluated separately. This means that signals do not need to meet the rule threshold simultaneously to generate a True assessment, only that signals meet the threshold in the same evaluation window.
- Examples:
-
- If a rule has 10 input signals, and the coverage setting is 50%, then an evaluation window in which any 5 of the signals individually meet the rule threshold will generate a True assessment.
- If a rule has 10 input signals, and the coverage setting is 100%, then only an evaluation window in which all 10 signals individually meet the rule threshold will generate a True assessment.
Alert Frequency
Alerts are a tool to manage the rate of rule assessment outputs. When signal behavior generates True rule assessments, the initial True assessment is important, but subsequent true assessments may not provide additional useful information as an issue is being investigated and triaged. Additionally, a rule may be used to create a record of signal behavior which is useful over time, but does not require immediate attention. For example, a rule may be used to count how many times a process is initiated each day, which is useful to track productivity, but does not require immediate attention.
- There are 4 alerting options.
-
- Never: this rule will never create an alert.
- Once per day, at most: If it has been at least 24 hours since the most recent alert, the next time the rule assessment is True, an alert will be created.
- Once per hour, at most: If it has been at least one hour since the most recent alert, the next time the rule assessment is True, an alert will be created.
- Every time: An alert will be created every time the rule assessment is True.
- Additional details on the once per day and once per hour options.
-
- Alerts are generated when a rule assessment changes from False to True for the first time after the specified time has passed since the most recent previous alert.
- For example, if the alert settings is "once per hour, at most," True rule assessments at 8:00 AM, 8:30 AM, and 9:05 AM will generate 2 alerts, one at 8:00 AM and one at 9:05 AM. No alert would be generated associated with the True assessment at 8:30 AM.
- If a rule is continuously generating True assessments, only the first True assessment will produce an Alert, even if the True assessment period lasts longer than the Alert setting.
- For example, if the Alert setting is "Once per hour, at most," and the rule generates True assessments for 2 hours continuously, only one alert will be generated, at the time of the first True rule assessment
Reference Signals
In Falkonry TSI, these are signals that are not used for AI-driven analysis such as anomaly detection or pattern recognition. These signals typically serve as contextual or status indicators—like setpoints, commands, or control parameters—that help interpret the behavior of other operational signals. While they don't contribute directly to model training or scoring, they are useful for rule-based evaluations and understanding machine or process states.
Sampling Period
The sampling period specifies the interval between two consecutive data points that the model processes. It controls the resolution of the data used in learning. A smaller sampling period captures more detailed behavior, while a larger sampling period reduces noise but may miss high-frequency events. e.g. A sampling period of 1 minute means the model processes one data point per minute from the signal stream.
Signal Characteristics
In Falkonry TSI, understanding signal characteristics is essential, as the nature of the data directly impacts what can be observed and analyzed.
Compressed Signals
Signals with unchanged values may be compressed and not displayed. Use sendOnChange to control visibility, but avoid pre-processing data before sending to Falkonry.
Countdown Signals
Monotonically decreasing signals similar to counters. These should not be used in AI models. Best treated as a reference only.
Counter Signals
Signals that count items, length, or time. These are not recommended for monitoring and are best used as a reference only. Example: total units produced.
Flatline Signals
Signals with constant values throughout the training period. Avoid using them in AI models, as they lack variability and may not display due to compression.
Also see Slow signals and Fast signals
Signal Metadata
Signal metadata provides essential contextual information about these signals, which includes signal name, description, units, properties like min & max Threshold, or gap detection. Signal metadata can be added or managed manually or in bulk via CSV import. Additionally, the signal tree assignment further amplifies the signal metadata.
Signal ID
A Signal ID is a unique identifier automatically assigned to every signal ingested into Falkonry TSI. It can be found under the Signal Information panel for each signal. This ID is used to consistently track, reference, and manage signals throughout the platform, and is required for API requests and system-level operations involving that signal.
Signal Origins
This refers to where the signal originates from.
User-provided signal
These are signals sent to Falkonry TSI from customer's systems and assets
Falkonry generated signal
Derived signals are generated by Falkonry TSI’s analysis, including anomaly scores, pattern predictions, rule-based alerts, and platform usage metrics. These signals originate from Insights, Patterns, Rules, Calculations, or system activity and help monitor performance, behavior, and platform operations.
Alert signal
An Alert (/alert) is an instance when the criteria of a Falkonry Rule is satisfied. It is a categorical signal and takes True values when an alerts has to be raised.
Anomaly Score signal
Anomaly score (/anomaly score) is real-valued score produced by Falkonry's anomaly detection process, where scores above 3 indicate rare behaviors or deviations from expected behavior. These scores provide a unified comparison scale across various sensor data, derived from a normalized reconstruction error. Scores denoted by a color gradient from green to yellow represent varying degrees of unexpected behavior worthy of investigation. Anomaly scores are output signals from Falkonry Insights.
Confidence signal
A confidence signal (/confidences) in Falkonry, also referred to as a confidence score or confidence value, is a numeric output signal generated by Falkonry's AI-based Patterns models including unsupervised, semi-supervised, and supervised models.
Its primary purpose is to represent the confidence associated with a model's prediction or classification. These values typically range from 0.0 to 1.0 (or 0% to 100%). Confidence signals are crucial for supporting model validation and improvement and aid in thresholding decisions for rules and alerts. For example, in supervised and semi-supervised models, if the confidence value exceeds a threshold (1 minus the Generalization Factor), the model's condition assessment will be applied.
Explanation signal
Explanation signal (/Explanation-) scores are float values between -1.0 and +1.0 that indicate the relative contribution of each signal to a particular assessment output. A higher score (closer to +1.0) suggests a higher correlation of the particular signal with the assessment outcome associated with the assessment point currently selected. In other words, the signal had a higher impact on determining the classification of the episode at the current assessment point. A lower score (closer to 0.0) suggests a lower correlation of the particular signal with the assessment outcome associated with the assessment point currently selected. A high negative score (closer to -1.0) suggests a high correlation of the particular signal with a classification other than the classification associated with the assessment point currently selected. They are output signals from Falkonry Patterns models and also an output signal of a rule.
Prediction signal
Prediction results (/predictions) represent the detected condition value for a given time within an assessment output. These are categorical outputs from Falkonry Patterns models. Falkonry Patterns are designed to discover meaningful temporal correlations and early warning signs.
Rule signal
A rule signal (/rule) is a rule output signal, that represents the assessment output of a Falkonry Rule. It is produced each time the rule is evaluated. The value of a rule signal is categorical, wherein a "True" value indicates that the rule's specified condition was met at that point in time and "False" otherwise. The Rule signals can be used as inputs to other, more complex (compound) rules, allowing for nested logic. They are displayed on the Rules Dashboard to show the rule's output in real-time.
Signal Properties
Signal Properties are system-defined, optional configurations that control the visualization and behavior of signals within Falkonry TSI. They can be set at the signal level, either through the user interface or by importing signal metadata via a CSV file.
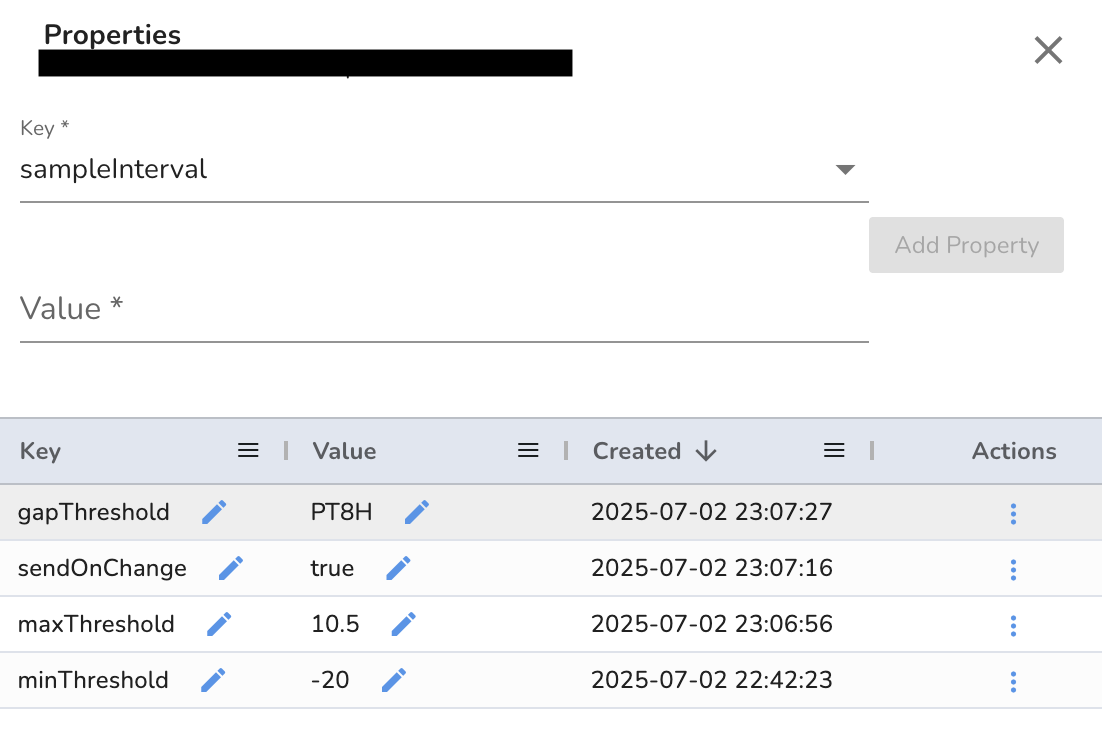
sampleInterval
Override the system calculated sampling rate for the signal using this property. The value must be ISO 8601 formatted duration. Example: PT1S
gapThreshold
It defines how long to hold the last signal value when new data isn't received. After the set duration, a data gap appears. It must be an ISO 8601 duration (e.g., PT8H). It can override gapThresholdFactor and may affect the Patterns model behavior. This property is supported when the Transformation setting is Default and the data is in Parquet file format
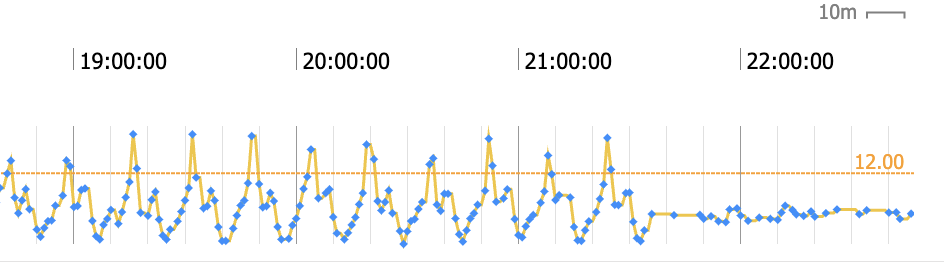
maxThreshold
An upper limit numeric value is shown as a line on signal charts to highlight when signal values exceed defined limits. It is part of the signal metadata and can be manually added or imported via a CSV file.
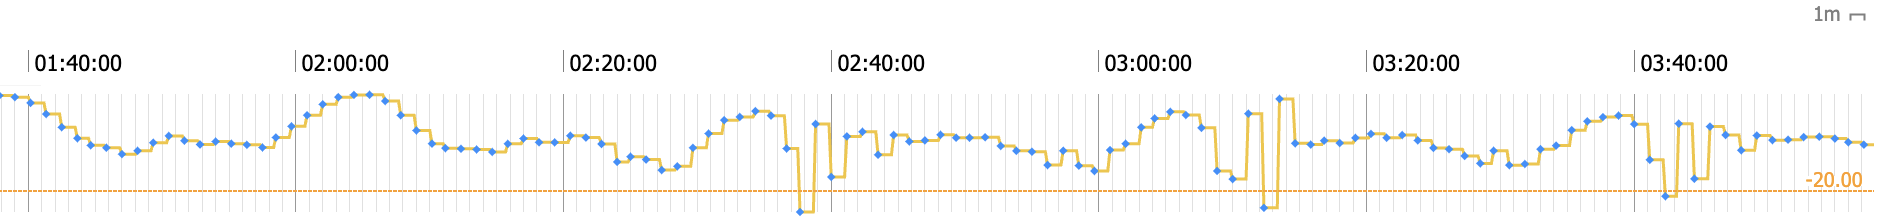
minThreshold
A lower limit numeric value is shown as a line on signal charts to highlight when the signal value drops below the limit. It is part of the signal metadata and can be manually added or imported via a CSV file.
sendOnChange
A boolean property that holds the value of the signal till it changes. Default is set to true
Signal Groups
A signal group is a label that relates multiple signals to each other. Its primary purpose is to organize and define subsets of signals for use in AI/ML model development, such as for modeling or reference. Signal groups are created within a specific Datastream and are not accessible from other Datastreams. A single signal can belong to multiple signal groups, and a group can contain one or more signals. You can add or remove signals from a signal group at any time, though changes only apply to newly developed models. For best results, a model signal group should ideally contain under 20 signals
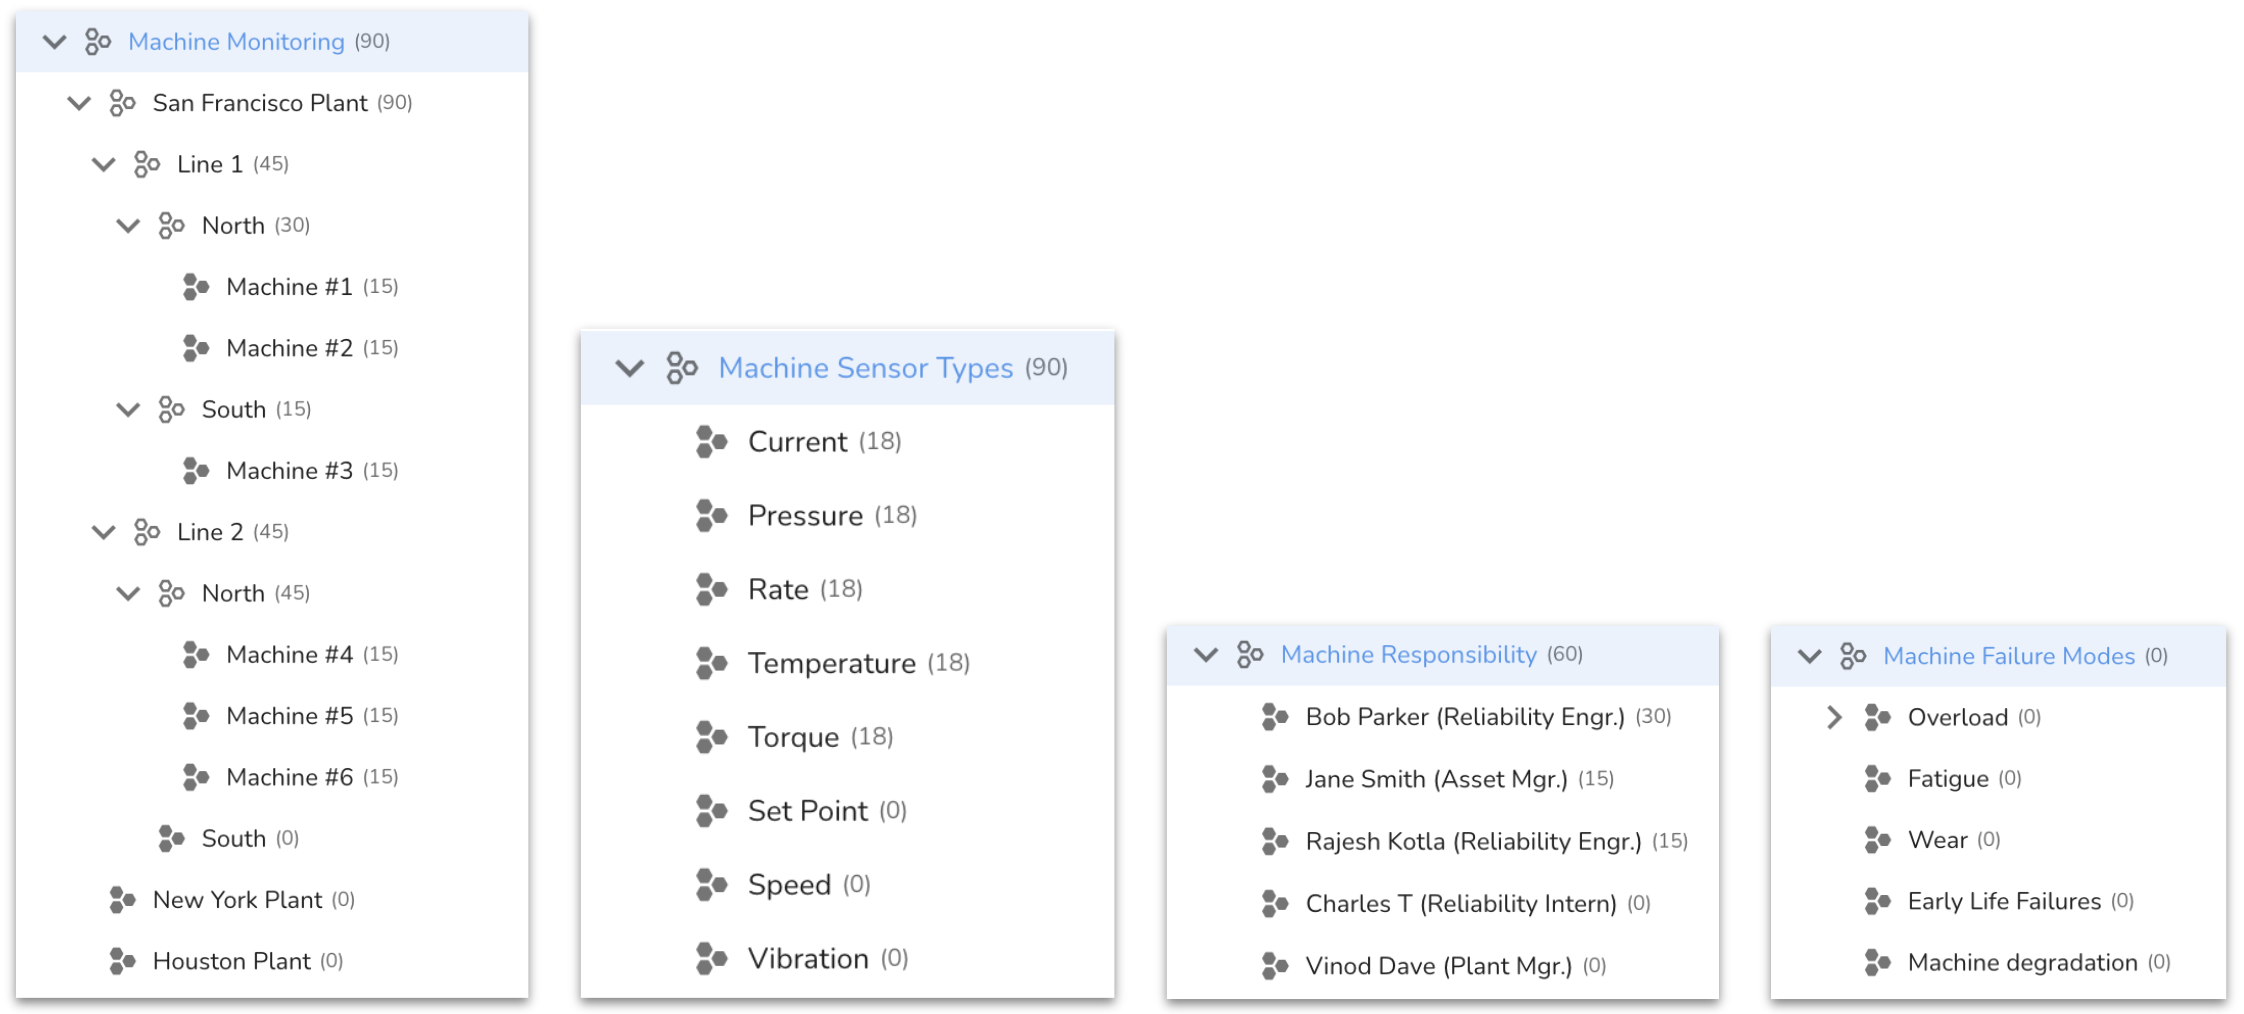
Signal Tree
A Signal Tree is a non-overlapping organization of signals to form hierarchical categories of Signals. Those nodes of a Signal Tree that a Signal is associated with, are treated as the Signal's metadata. For example, if a Signal specifies two pieces of metadata, such as being part of a certain service/process and being of a certain measurement type, then that Signal becomes a part of two non-overlapping Signal Trees.
Source / Connected Source
A Falkonry representation of data which can be used to create a signal. A source must be mapped in order to assign that source's data to a specific signal name belonging to a specific entity in a specific datastream.
Assessment output (conditions) are stored as sources so that they can be used as signals in another model. This is necessary to create a model of models.
Stride
In Falkonry, "Stride" is also referred to as Assessment Rate, which is how often an expression or model is evaluated.
Time Range Selector
Time Range Selector in Falkonry TSI allows users to quickly switch between different predefined or custom-defined time windows for analysis. It supports both, specific and relative time range. This tool helps in focusing on specific periods — such as recent anomalies, production cycles, or historical events—enabling more targeted and efficient reviews of signal behavior.