Glossary: Time Series Basics
Time Series
A time series is a sequence of data points collected or recorded over time to track the behavior or measurement of a specific subject or variable across time, allowing analysts to observe trends, patterns and changes.
Time (Timestamp)
All time series data begins with a time component. Falkonry TSI supports several standard time formats, including Unix epoch and ISO 8601, as well as granularities down to Seconds, Milliseconds, Microseconds, and Nanoseconds. It is crucial that the time key and format remain consistent across all data points of a time series.
Signal
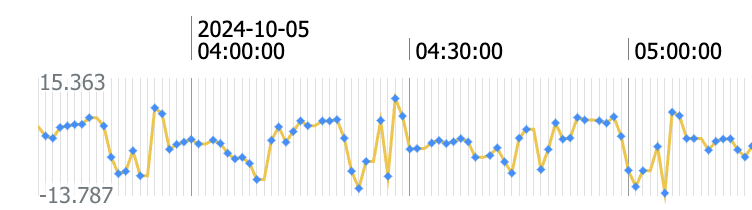
A Signal is a time varying sequence of values recorded at arbitrary intervals,
where these values can be compared across timestamps. A Signal comprises a
series of <timestamp, value>pairs that represent the same quantity over time.
Also see Signal Groups
Numerical Signal
A signal which is composed of real-valued data. For example: a series of temperature or pressure readings are typically recorded as integer or float type values.
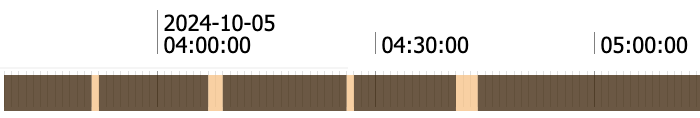
Categorical Signal
A signal which is composed of discrete data. For example, a text (string), boolean type data or discrete numeric levels, such as the phase number of a process (1, 2, 3), the position of a switch (open, closed), steel type, alarm state (true, false), etc.
Sampling rate
The interval between two consecutive values in a signal is called its sampling interval. When measured in terms of the number of consecutive values per unit of time, this becomes sampling rate. The number of such values collected per second is defined as the sampling frequency.
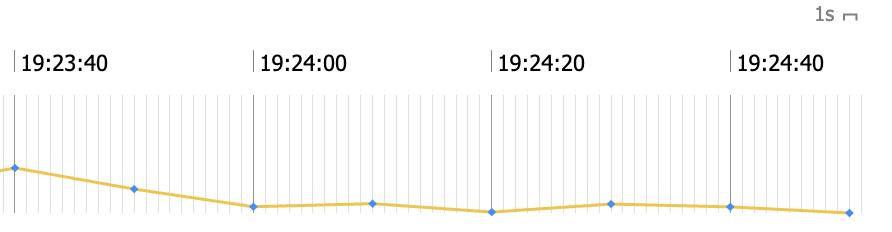
Low sampling frequency
When a Signal has a sampling frequency of less than 100 mHz, i.e., 1 sample every 10 seconds or slower, it is considered to be of a low sampling frequency.
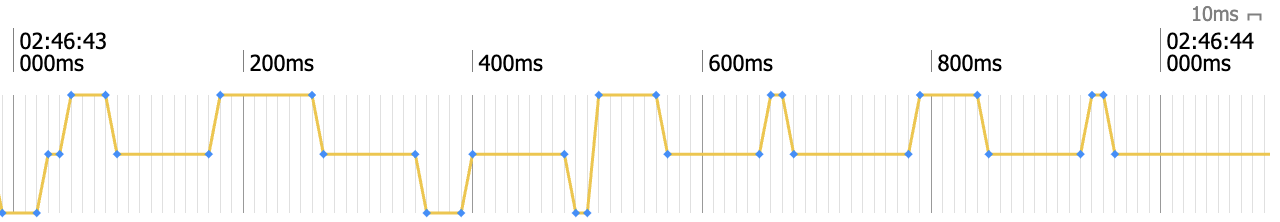
High sampling frequency
When a Signal has a sampling frequency of more than or equal to 1 Hz, i.e., 1 sample every second or faster, it is considered to be of a high sampling frequency.
Smart Alerts
Alerts from Falkonry TSI are Smart Alerts because they go beyond simple threshold triggers, making them more relevant, actionable, and reliable. They incorporate:
AI-based insights: Alerts can be driven by anomaly detection or pattern recognition models that understand normal vs. abnormal behavior across multiple signals.
Persistence logic: Conditions must hold true over a specified duration before triggering, reducing false positives.
Multi-signal conditions: Rules can combine multiple signals, thresholds, and model outputs.
Contextual metadata: Alerts include rich context like signal names, asset hierarchy, and timestamps, aiding quick diagnosis.
Window
This refers to the data considered during an evaluation. There are several common windowing terms:
Tumbling Window
A window where its duration is equal to the assessment rate, meaning there is no overlap between consecutive windows, and a 1:1 relationship between events and windows.
Sliding Window
A window whose duration is greater than the assessment rate, resulting in overlapping windows and a many:1 relationship between events and windows. This type of model performs assessments based on time, at regular, fixed intervals, by examining a "window" of historical data that slides over the time series. It is well-suited for systems that are continuously operated and monitored where conditions might change continuously.
Sampling Window
A window whose duration is less than the assessment rate, with no overlap.
Session Window
A data-dependent window with no overlap.
Also see Lower window bound, and Upper window bound
Latency
System Latency
The delay experienced in processing or viewing data within the system after it is received in the system.
Total Latency
The time difference between when data is created at its source and when all results of processing it is available in the system. Total latency includes system latency.
Entity
Any individual item—such as an asset, device, service, node, machine, or person—from which time series data is continuously collected via one or more sensor or metric