Using Falkonry Reports
Report and Widgets
The TSI Clip below shows the different data visualizations supported in Falkonry TSI.
Widget Types
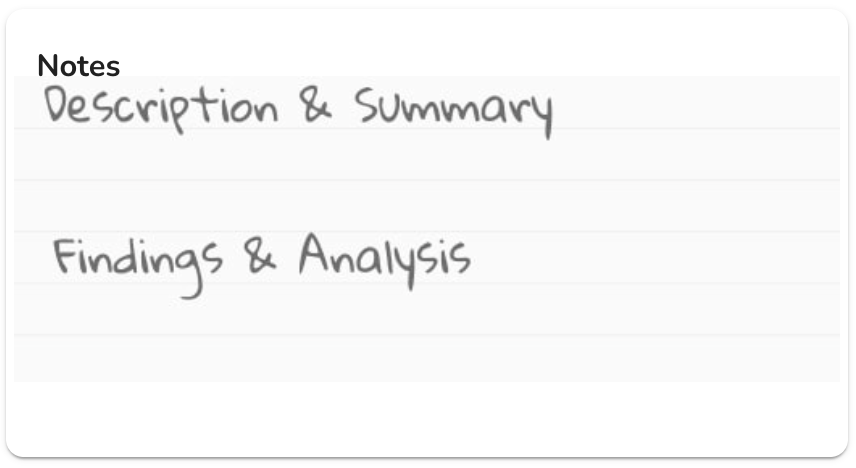
Notes
A rich text editor to capture your analysis using text, tables, images, videos, etc. Use the Report notes to collaborate and share your analysis, conculsions, root casuses, or currate a knowledge base of maintenance tasks for future use.

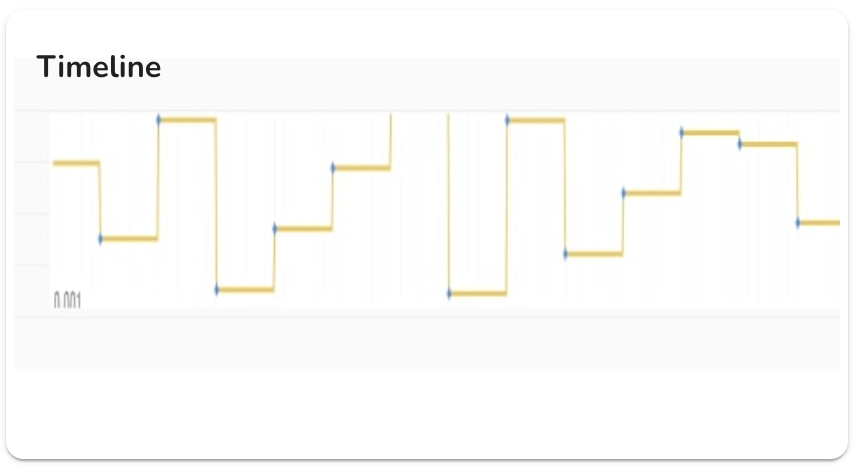
Timeline
A wall of timeseries data for a given timerange. Select this to view raw (input) signals or system generated output signals like /anomaly score, /rules, /alert, calculations output, /predictions, /confidences, /explanation, etc. View the data trends or hotspots in the data.
A timeline chart of type "Anomaly" will provide a heat view using the corresponding /anomaly score for the selected raw signal. This is avaialble via API only.

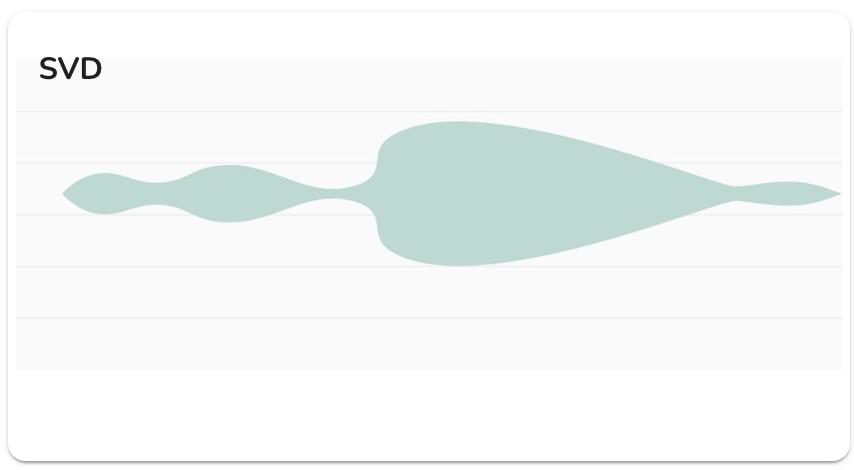
Signal Value Distribution (SVD)
Compare the violin charts of signal values for 1. a single signal across multiple time ranges, 2. multiple signals across a time ranges, 3. Categorical signal across multiple time ranges or bin by time
