Signal Tree Navigation and Filtering
Falkonry Time Series Intelligence enables you to quickly and easily navigate and search your Signal Trees, no matter their size.
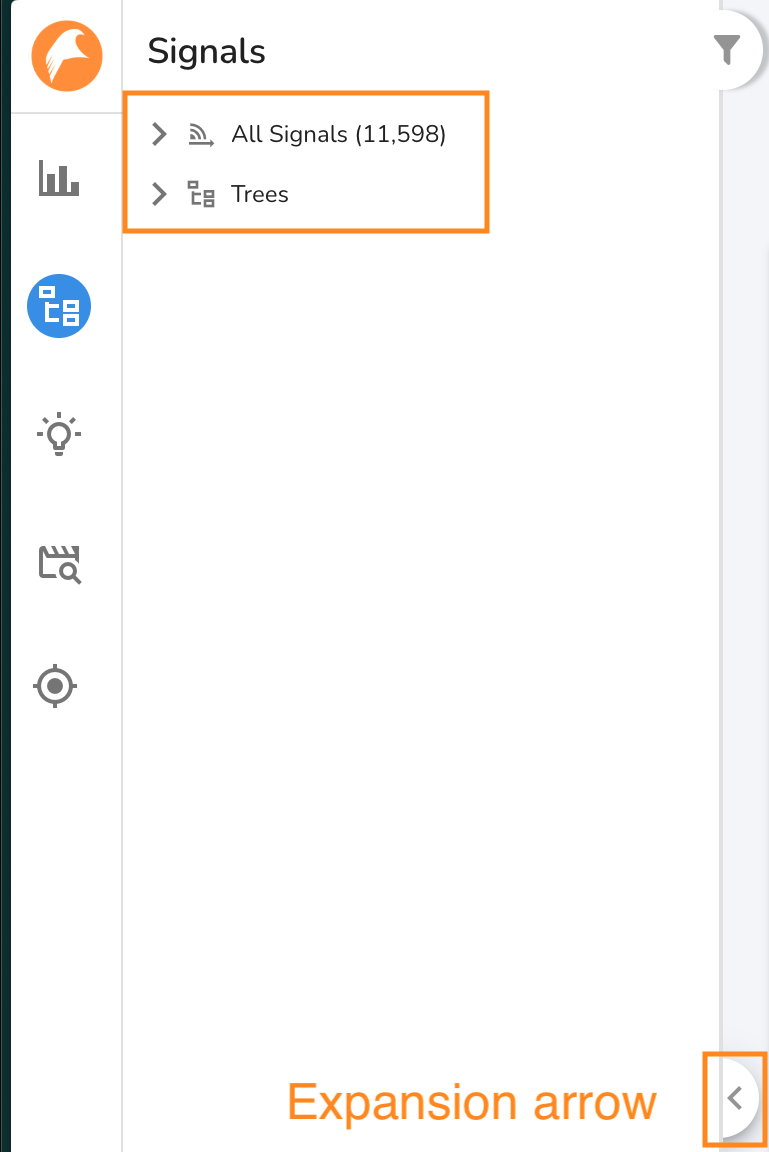
When using the Signals App, you will see the Navigation Panel on the left side of the page. Using the Navigation Panel, you can quickly traverse your Signal Tree Hierarchies to find the Tree Nodes and Signals you are looking for. You can open and close the Navigation Panel by clicking the expansion arrow.
The Navigation Panel has two sections.
- All Signals
- Trees
All Signals Page
The All Signals Node presents all your signals in a single place with no hierarchical information. The All Signals Node has three tabs which provide different views of your signals.
- Dashboard Tab The Dashboard Tab of the All Signals Node displays your signals in timeline charts.
- Signals Tab The Signals Tab displays your signals in a tablular view. In the table you can see metadata about your signals such as the number of datapoints loaded into Falkonry TSI, the earliest and latest point, and more.
- Draft Signals Tab The Draft Signals tab displays the signals which
have been loaded into Falkonry TSI, but not yet approved for ongoing
ingestion and processing. To learn more about draft signals click
here <approving-signal-in-falkonry>.
Tree Nodes Pages
Navigation
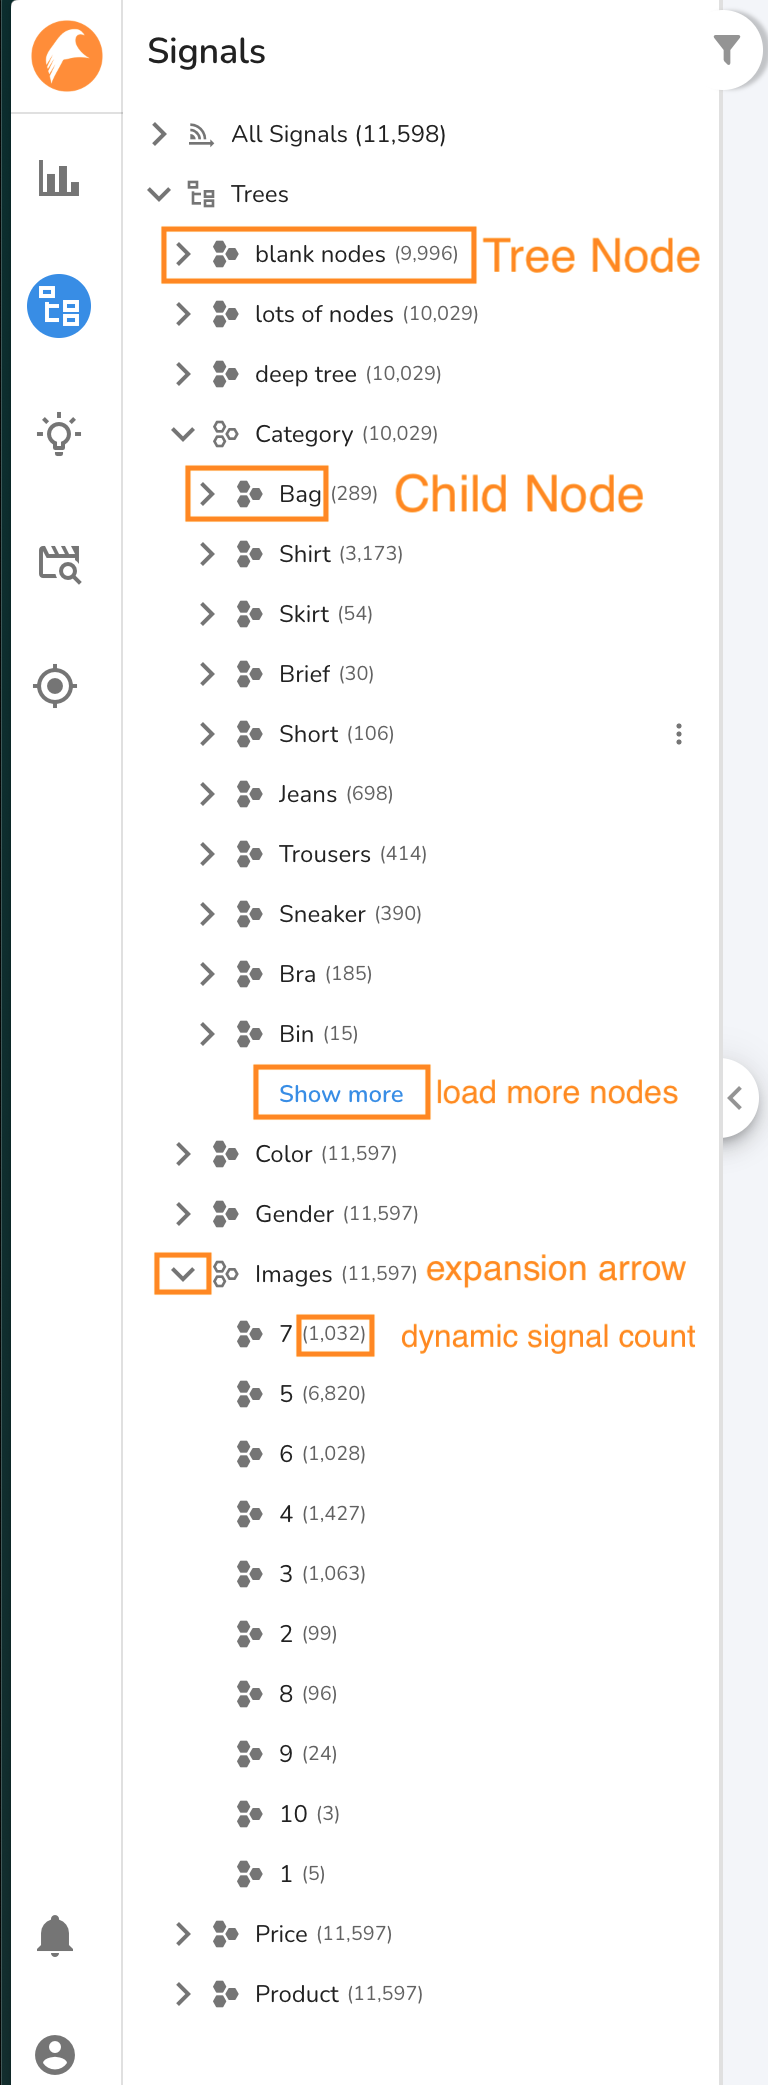
The first 10 trees are shown in the Navigation Panel below the All Signals node. If you have more than 10 Trees, a show more link is displayed. Clicking on the show more link will load 10 additional trees. To see nodes within a hierarchy, click the expansion arrow for that node and up to 10 child nodes will load. If there are more than 10 nodes in the hierachy, a show more link will appear. Clicking the show more link will load 10 additional nodes. You may expand nodes from different hierarchies, or different parts of one hierarchy, simultaneously. More than one show morelink may be visible in the naviagation pane at a given time.
Each node displays a dynamic count of the number of signals assocated with the node and its child nodes. This number will update as you expand the tree, or filter signals via attribute search.
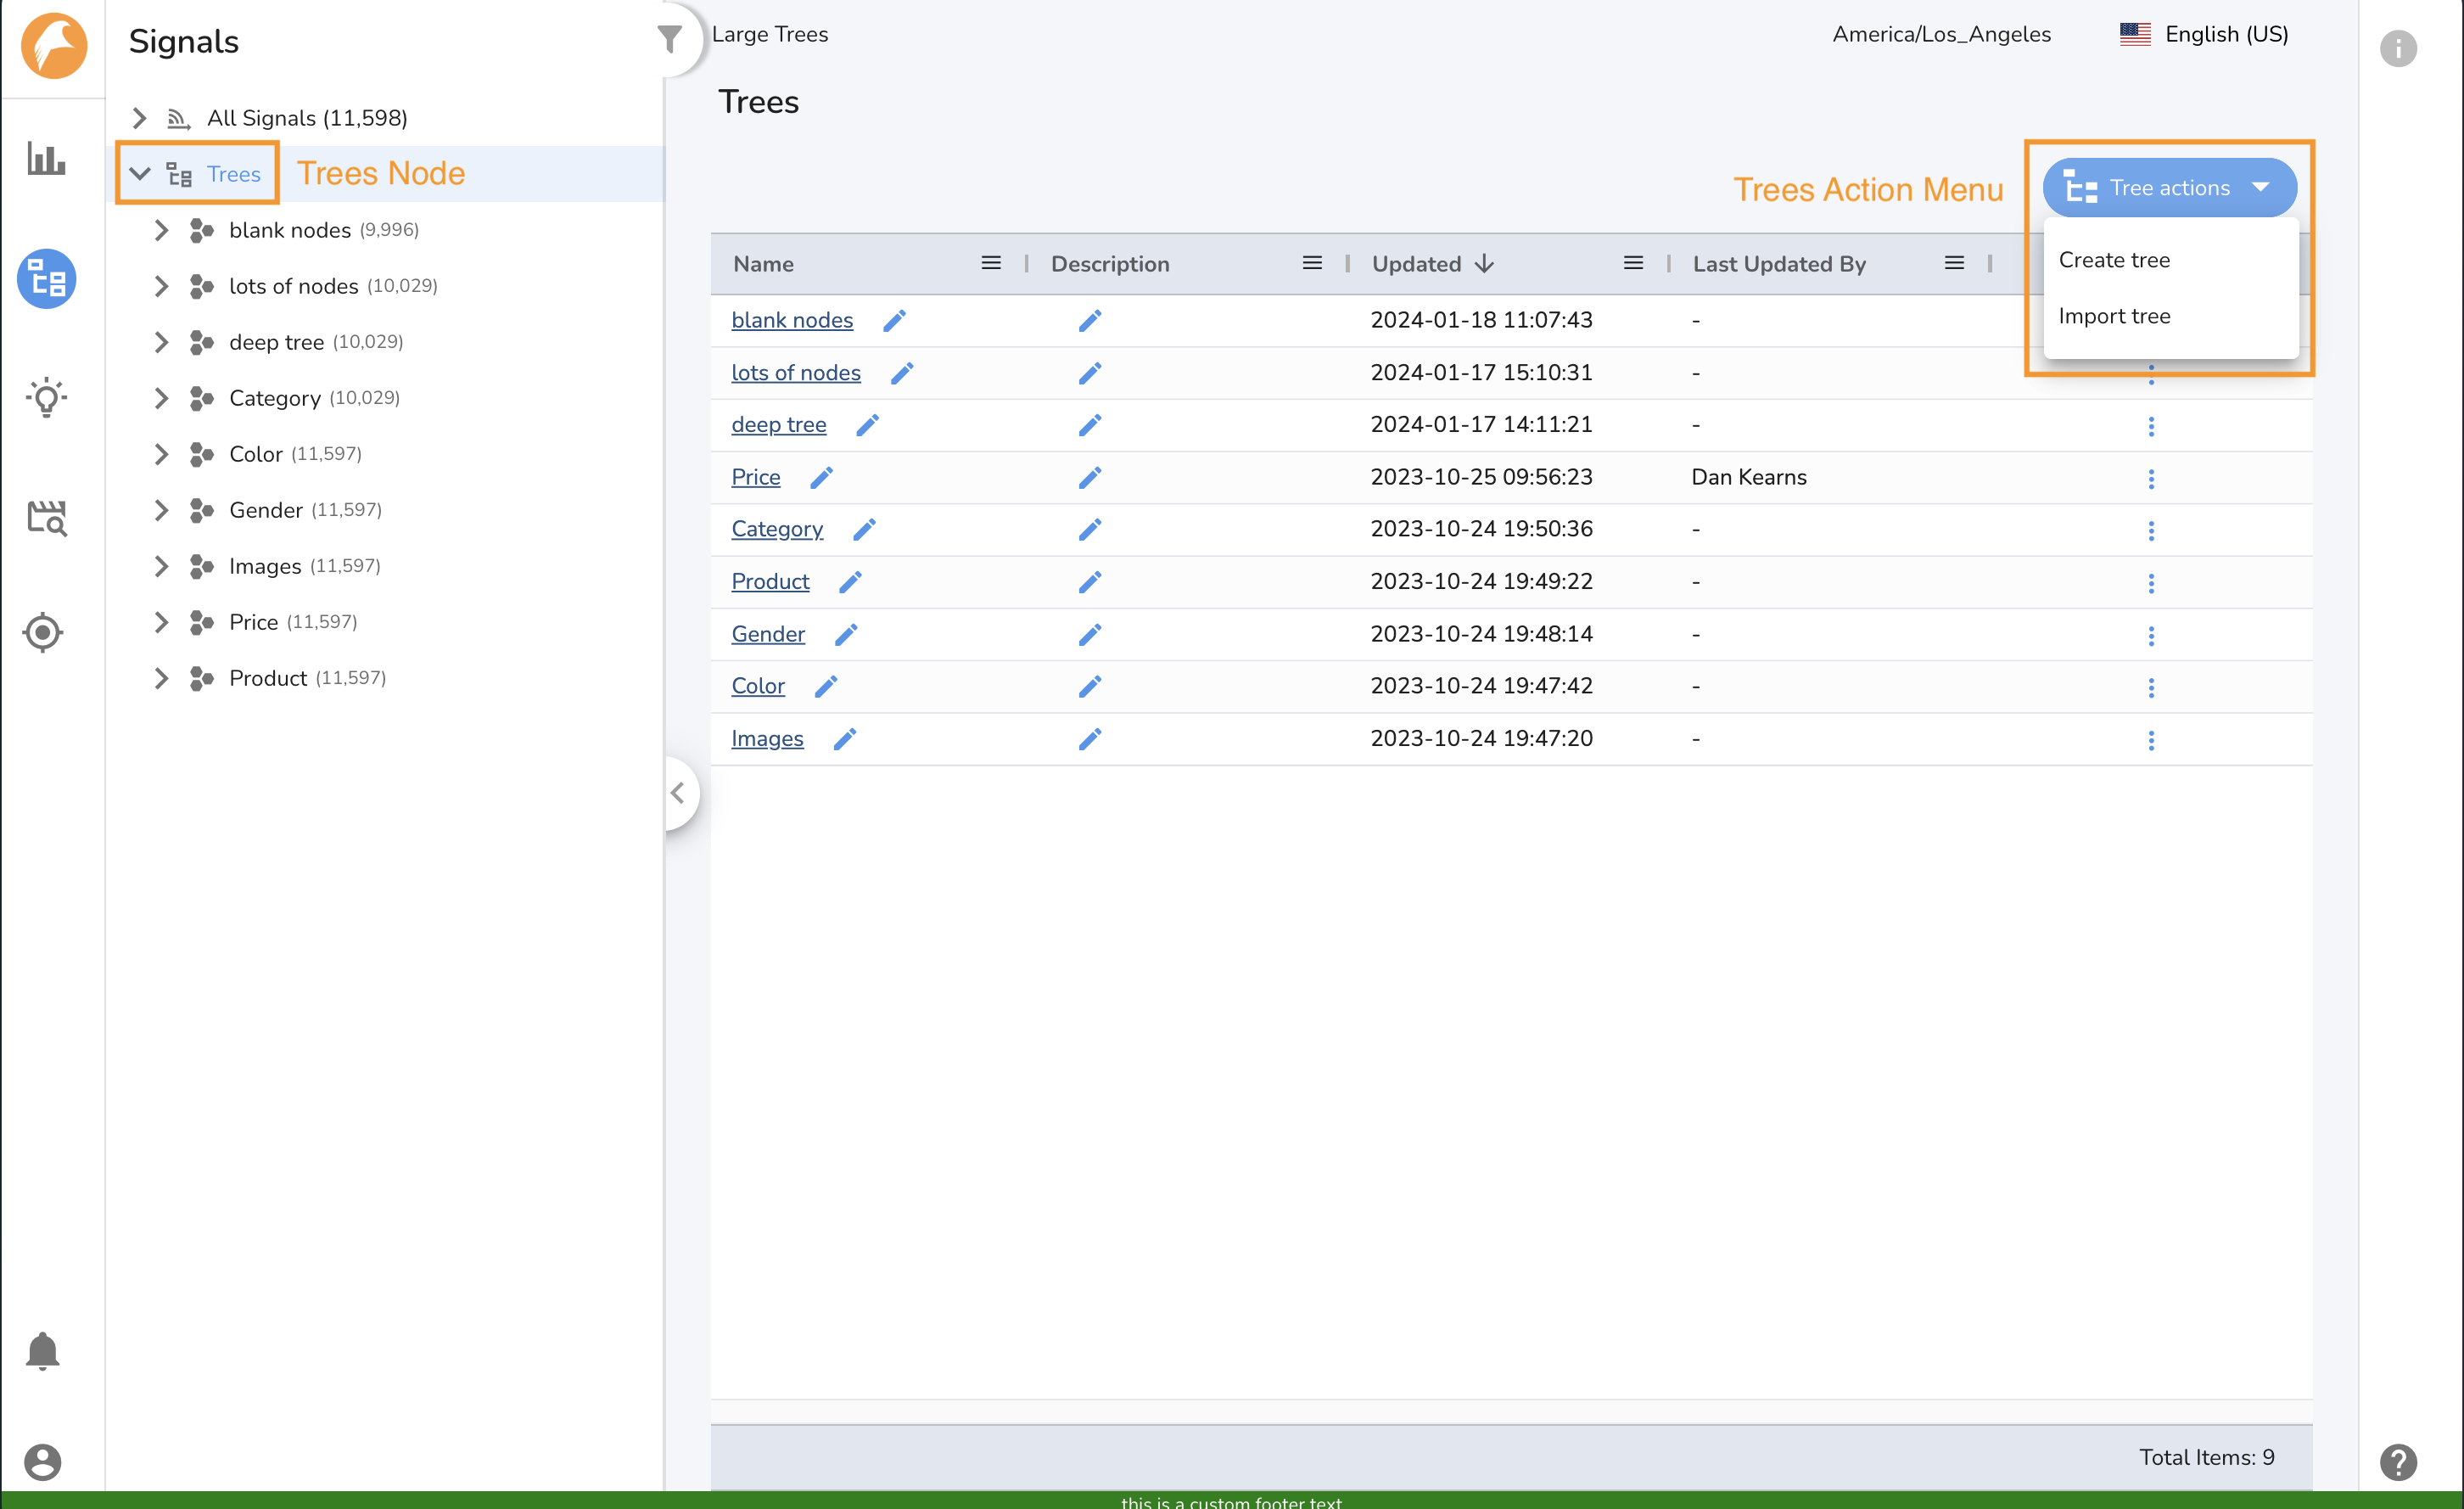
Trees Page
Clicking on the Tree Node will load the Tree page. The Tree page enables
you to modify and create Trees. To learn more about creating and editing
Trees, click here <creating-a-signal-tree>{.interpreted-text
role="ref"}.
Node Page
To view the signals associated with a node, click on a node in the Navigation Panel. The Node Page has two tabs to display signals associated with the node.
- Dashboard Tab The Dashboard Tab displays the signals associated with a node in timeline charts. It has two sections. The upper section, called the Reference Section, displays any signals from your account. To add or remove signals, click the R icon. The lower section, called the Signals Section, displays signals associated with the selected node. When Attribute Filters are applied, only signals which meet the filter criteria will be displayed in the Signals Section.
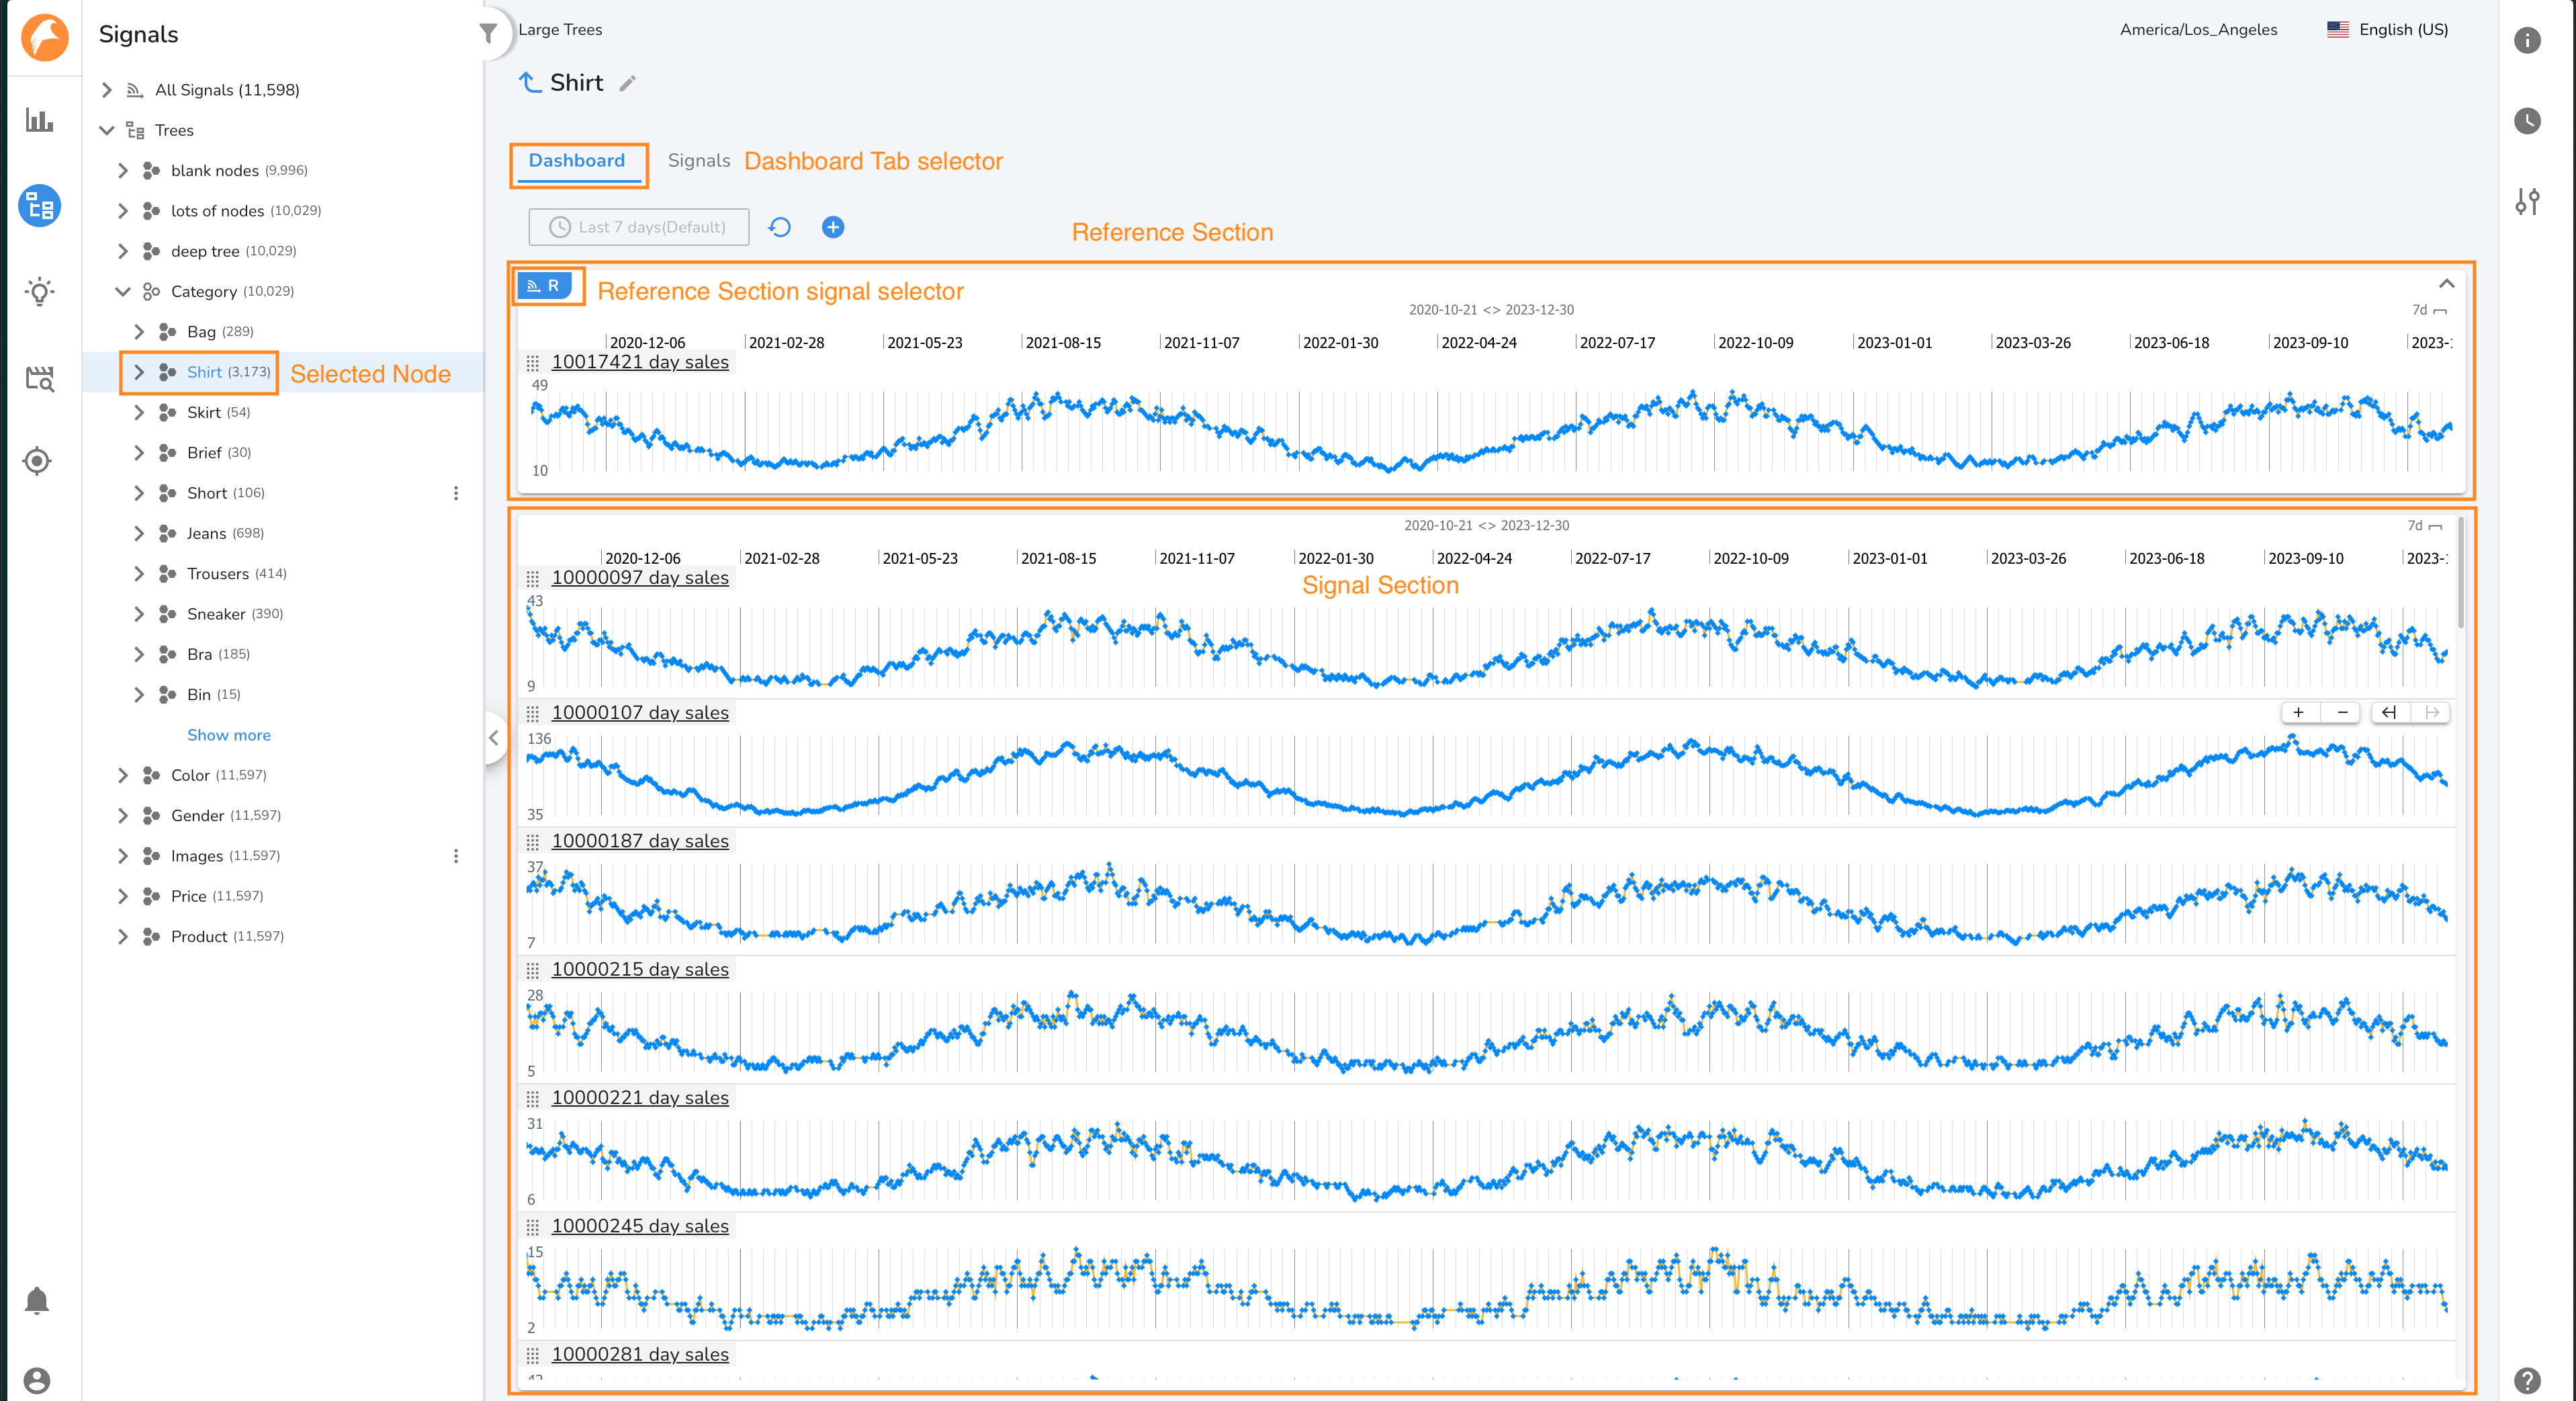
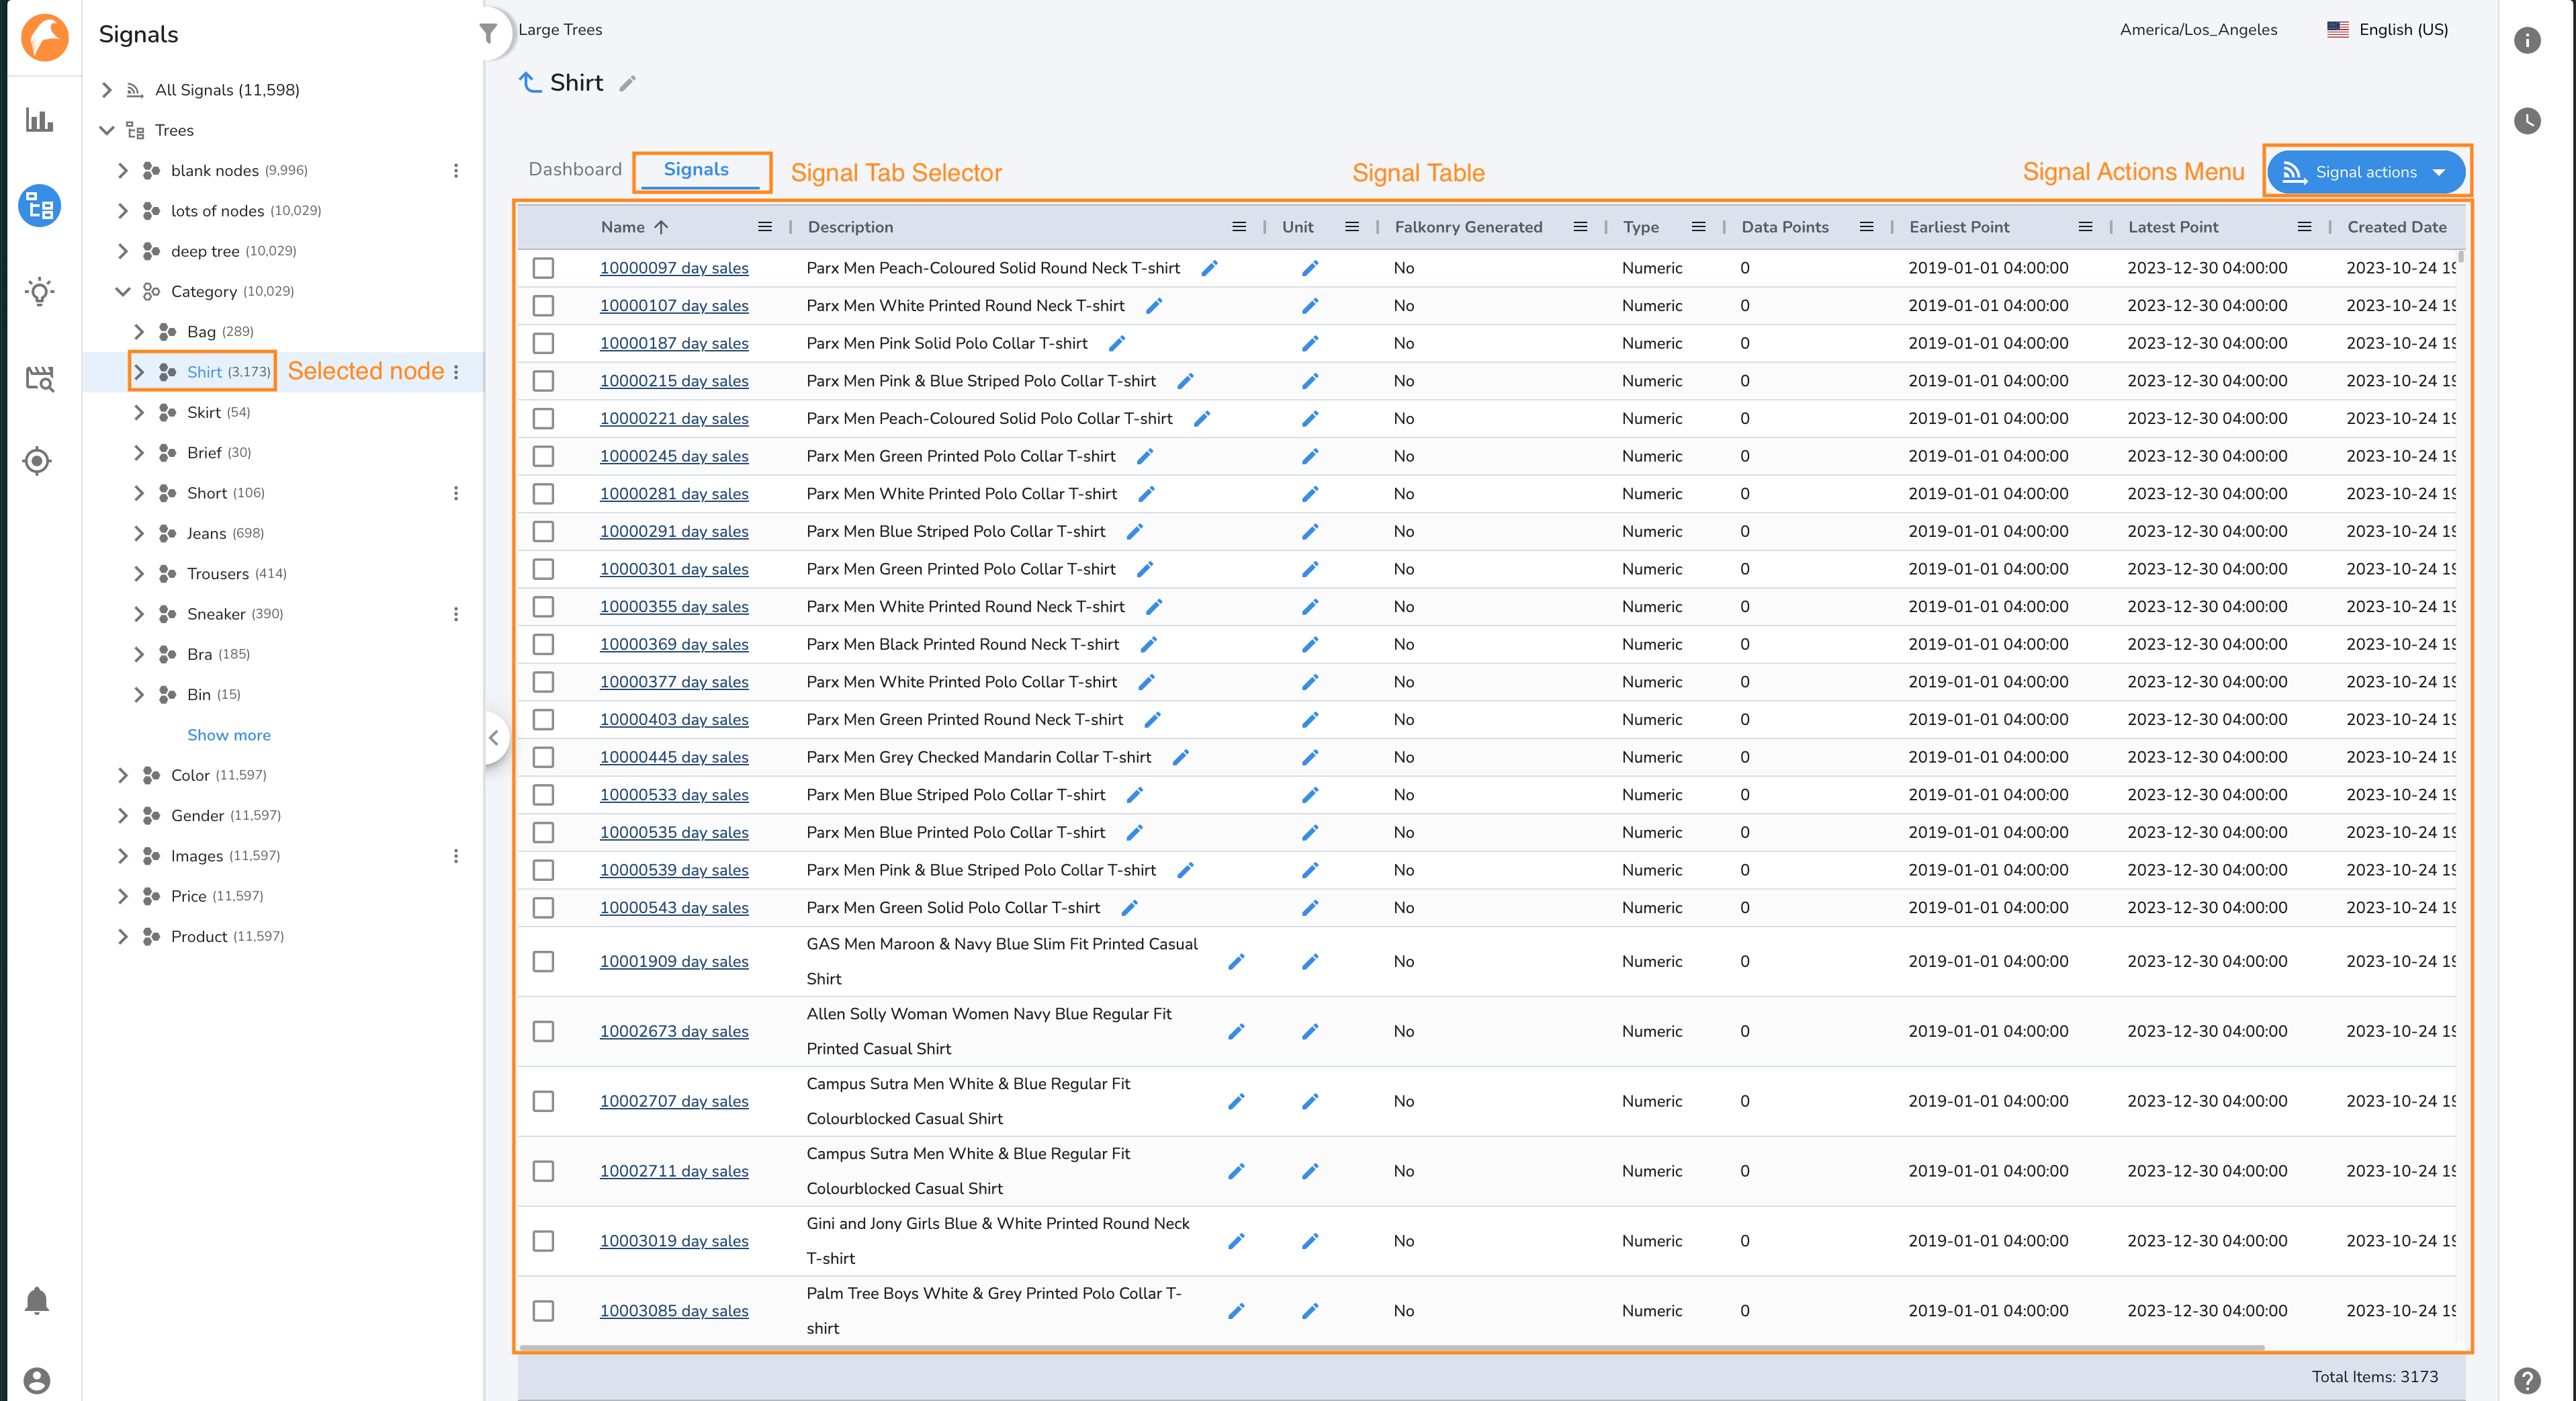
- Signals Tab The Signals Tab displays the signals associated with a node in a tabular view. In the table you can see metadata about your signals such as the number of datapoints loaded into Falkonry TSI, the earliest and latest point, and more. [screenshot]
Signal Attribute Filters
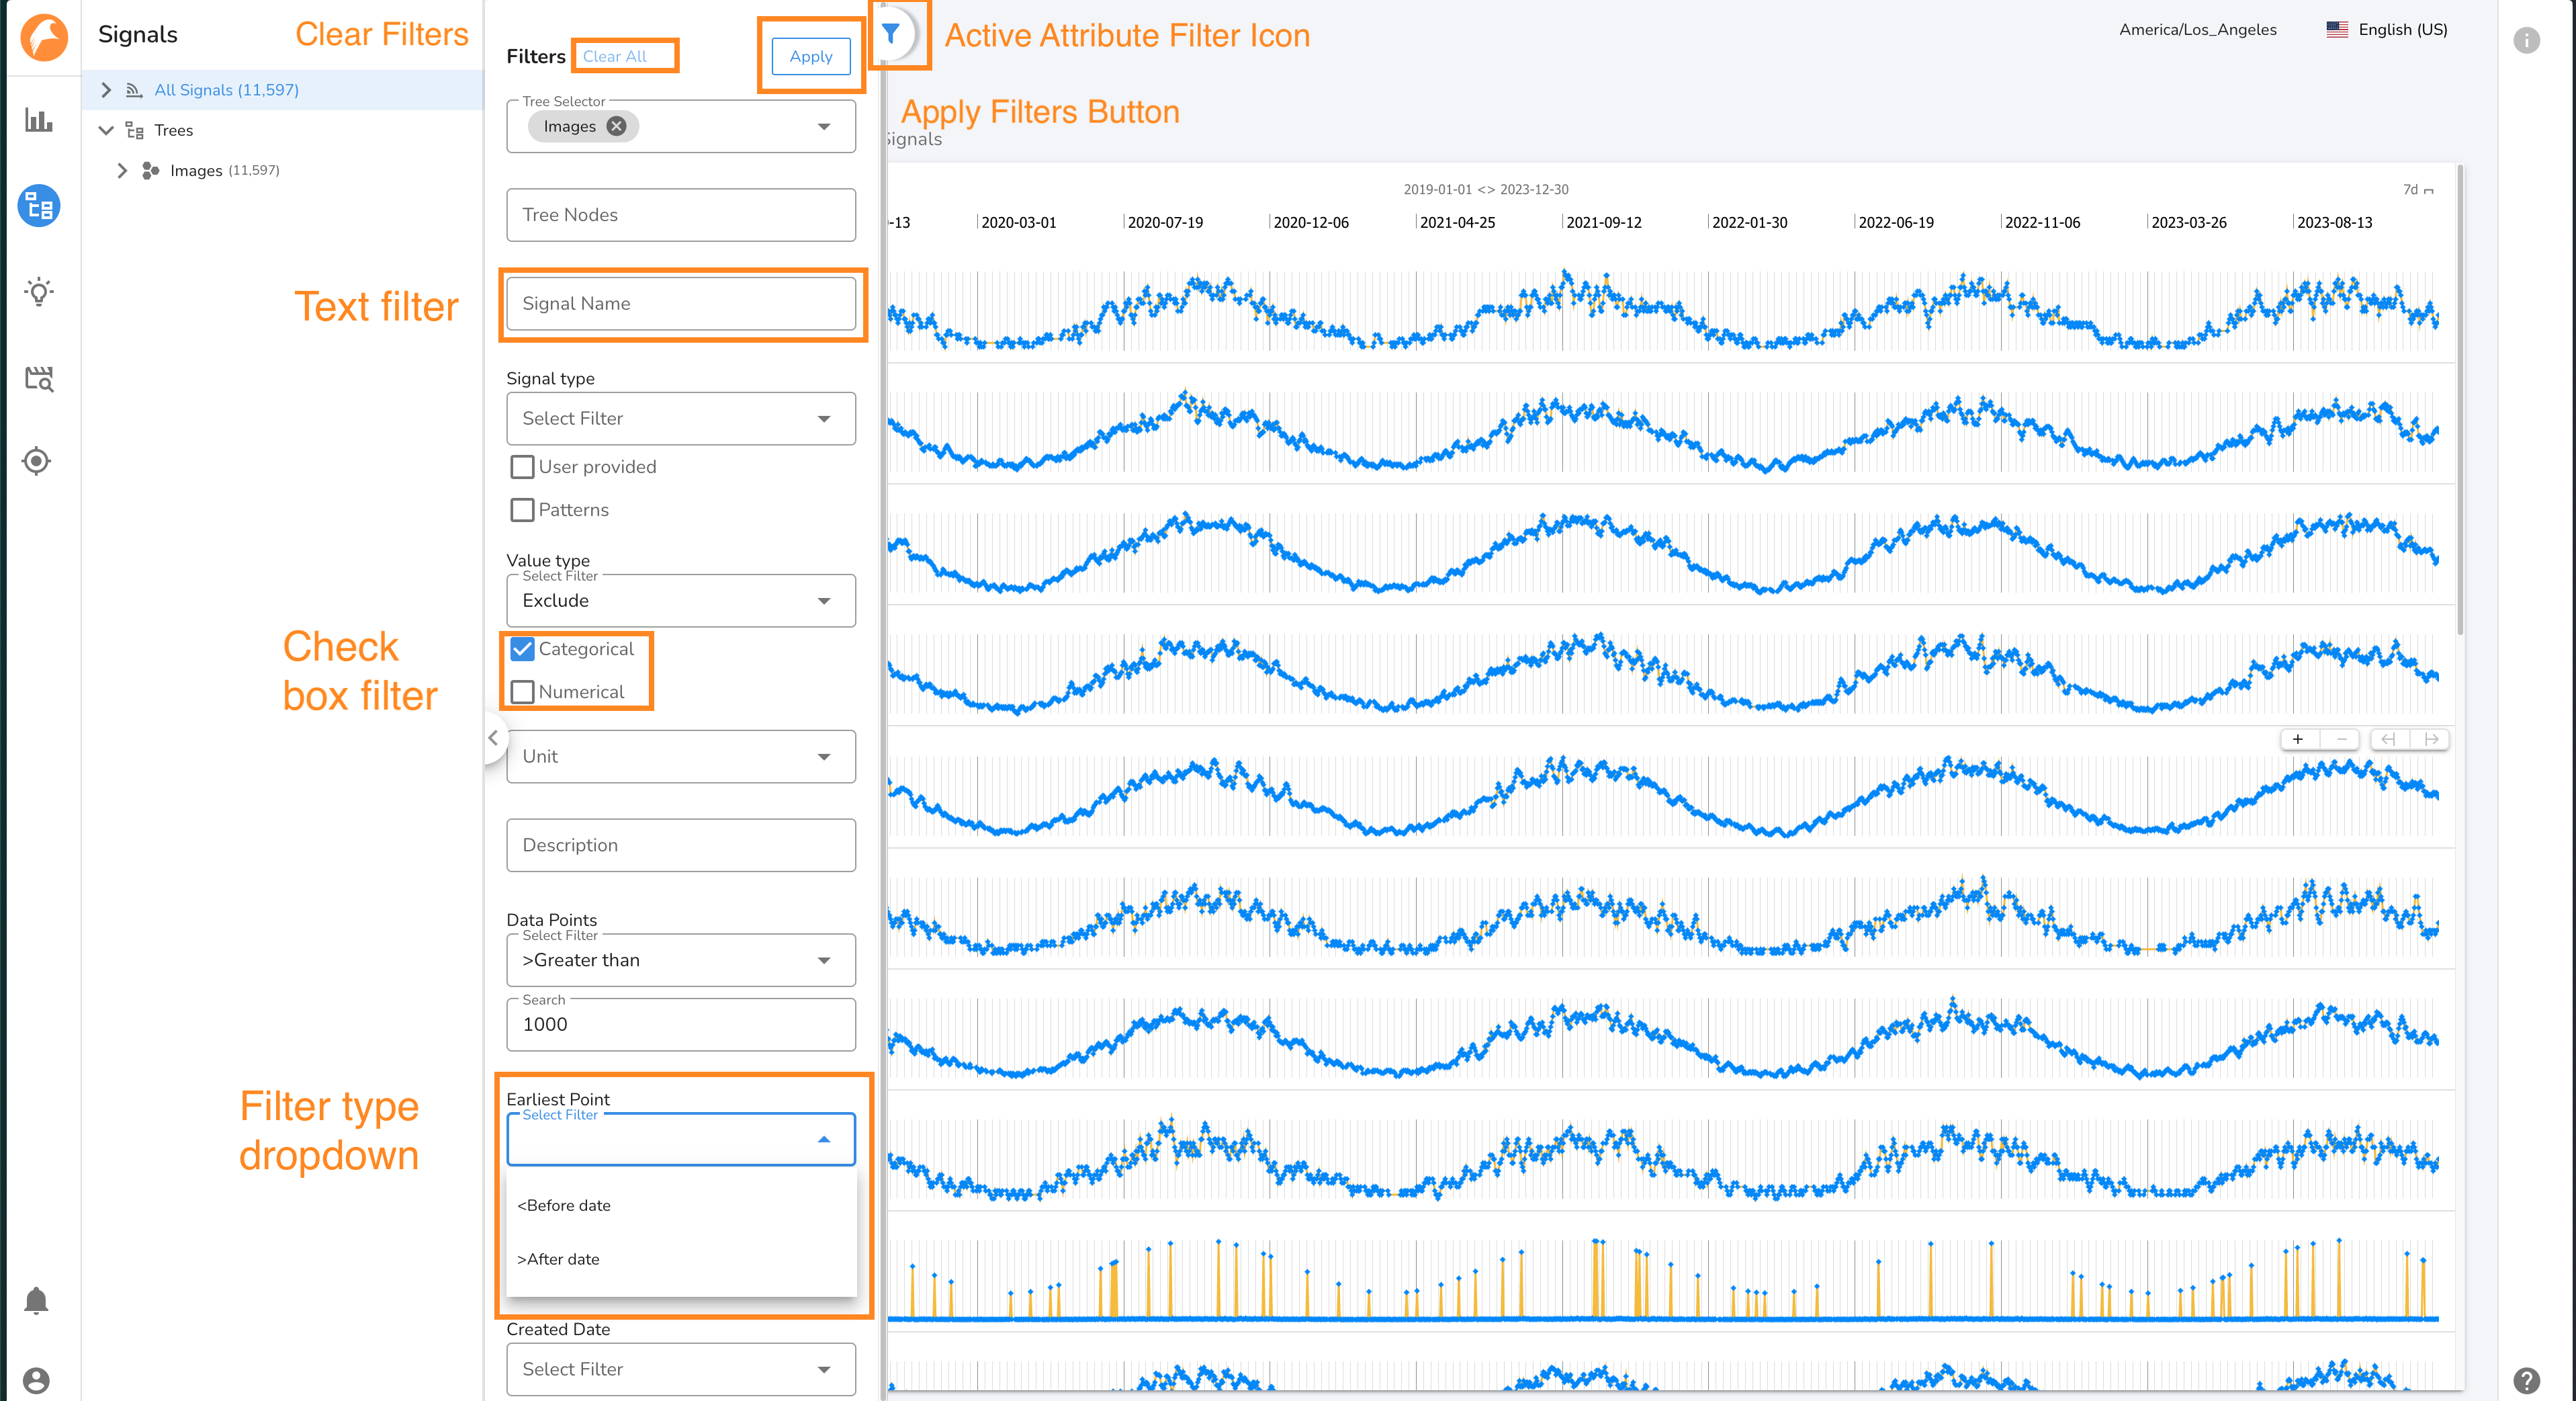
You may filter the Navigation Panel and Signals clicking the Attribute Filters button. This will open the Attribute Filter Panel, which enables you to filter by signal attributes. To apply one or more filters, click the Apply button.

When filters are applied, the Attribute Filter Icon will show as active. You will be navigated to the All Signals Node, which will display all signals which meet your filter criteria. The Navigation Panel will also update, displaying only trees and nodes which meet the applied filter criteria. The signal counts in the Navigation Panel will also update to reflect the number of signals associated with a node which meet the filter criteria.
To update the filter criteria, open the Attribute Filter Panel, update the filter criteria, and click apply. To clear the filter criteria, click the Clear All button.
Filters
Within a filter criteria, multiple filter criteria will perform an \"OR\" operation. For example, in the Units attribute filter, selecting degrees and pressure will return signals with the units degrees OR signals with the units pressure. Across filter criteria, multiple filter criteria will perform an \"AND\" operation. For example, filtering the Value Type to \'categorical\' and the Node Name filter to \'Node 1\' will return categorical signals assigned to Node 1.
Some filters let you choose how to apply the filter. For example, for the Created Date filter, you may choose to filter to signals created Before or After the selected date.
Below is a list of the signals attributes which may be filtered.
- Tree Name Filters Trees by their names. Regex enabled.
- Node Name Filters Tree Nodes by their name. Regex enabled.
- Signal Name Filters signals by their name. Regex enabled.
- Signal Source Filters signals by the source of the signal.
- User Provided signals are those sent to TSI from the your system.
- Patterns signals are the outputs of Falonkry Patterns models.
- To filter to signals which are the outputs of Insights, set the filter type to Exclude, and check both User Provided and Patterns options.
- Value Type Filters the signals based on the type of data the signal contains.
- Unit Filters signals by the Units property, which can be set upon ingestion, or on the Signals tab on the All Signals Page.
- Descrition Filters signals by their description, which can be edited on the Signals Tab of the All Signals Page.
- Data Points Filters signals by the total number of data points associated with a signal in Falkonry TSI. The filter may be set to \"greater than\" or \"less than\" a value.
- Earliest Point Filters signals by the the date of the earliest data point associated with a signal. The filter may be set to \"before\" or \"after\" a date.
- Latest Point Filters signals by the the date of the latest data point associated with a signal. The filter may be set to \"before\" or \"after\" a date.
- Created Date Filters signals by the the date the signal was approved in Falkonry TSI. The filter may be set to \"before\" or \"after\" a date.
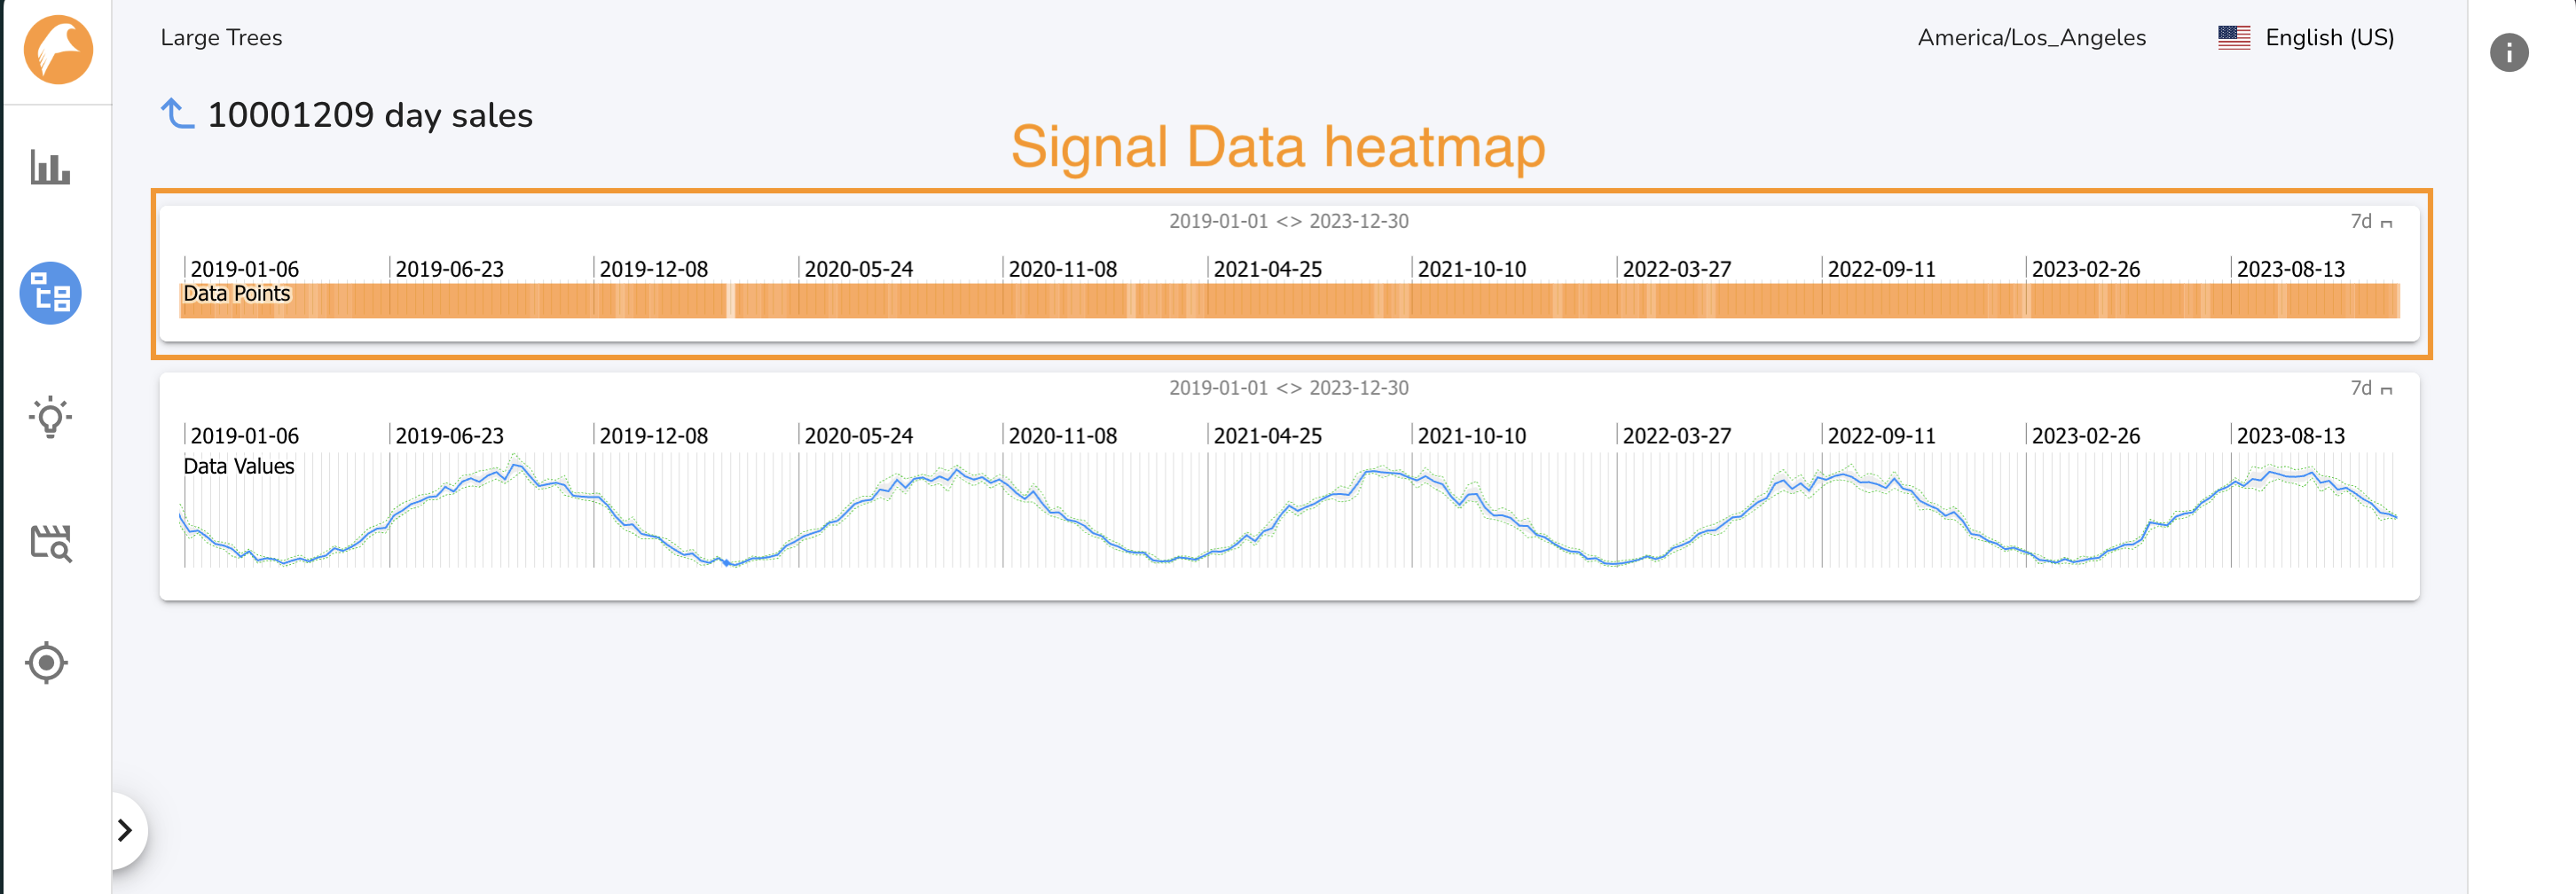
Single Signal page
The Single Signal Page shows a signal and visualizes the data density for that signal. This is a quick way to determine if Falkonry TSI has been consistently recieveing data for a given signal. To access the Single Signal page for a given signal, click on the signal\'s name on the Signals Tab of the All Signals page or a Tree Node page. Click the back arrow to return to the ALl Signals page. When you navigate to a Single Signal page, a node is displayed in the Navigation Panel under the All Signals node. Up to 10 Single Signal nodes will be displayed.