Signal Management
Signals
A Signal is a time varying sequence of data; a series of \<time, value> pairs. For example, each sensor reading from a system is captured as a signal. There are two types of signals - Numeric and Categorical.
Numeric Signals
A signal which is composed of integer or float type data. For example: a series of temperature or pressure readings are typically numerical.
In order to view high-frequency data over extended periods of time, graphs do not always display every raw data point. Instead, when zoomed out, numeric signals show aggregate information about the raw data rendered as line charts wherein each signal has 5 lines. This helps the user understand the underlying signal data even when the individual data points cannot be resolved at the current level of zoom. The figure below explains the meaning of these lines:
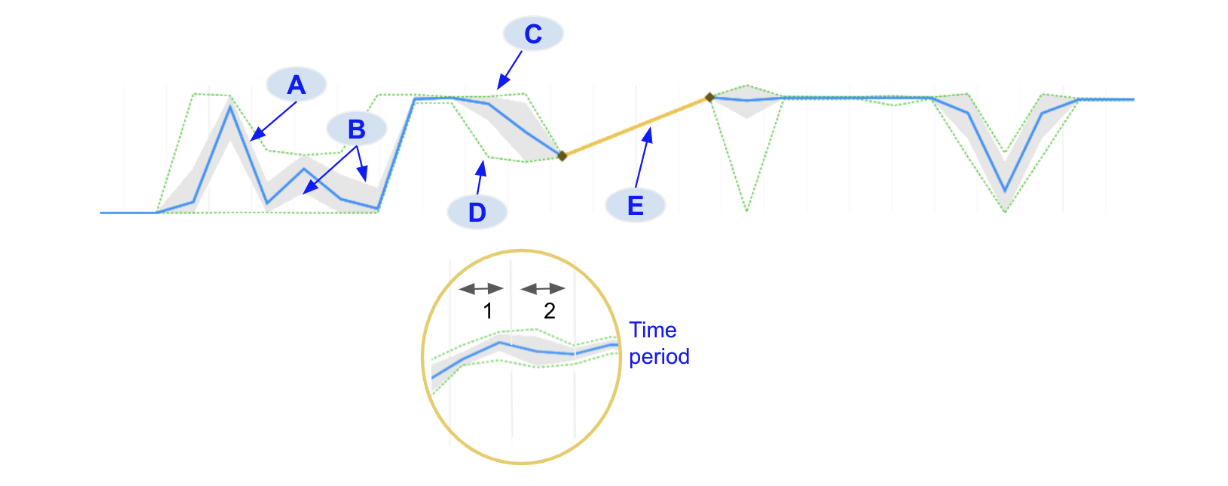
A. Mean: The blue line indicates the average value for all signal data points in that time period B. Standard deviation (+1σ and -1σ): The filled gray region around the mean indicates the standard deviation of all signal data point values in that time period C. Max: The upper green dotted line indicates the maximum value for all signal data points in that time period D. Min: The lower green dotted line indicates the minimum value for all signal data points in that time period. E. Gap: When there is a region of missing values in the data, the system connects the two data points on either side of the gap with a yellow line
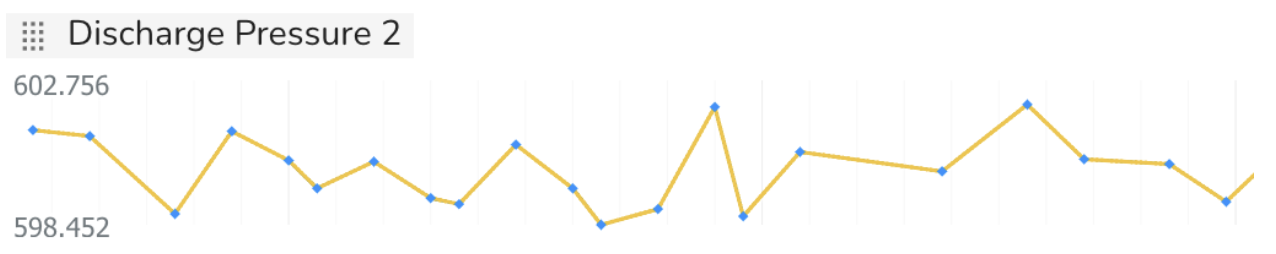
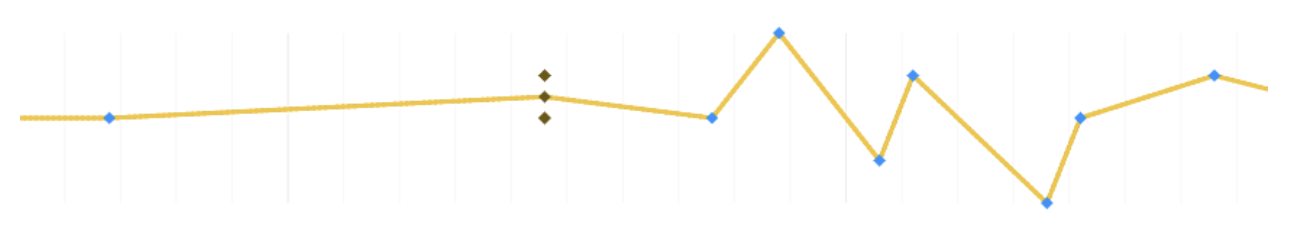
The time period over which these statistics are calculated will be shown in the numerical data caption. When a user zooms in far enough the raw data points will appear, designated with blue diamond markers.
Sometimes, when zoomed in, there may be regions in the data where there is more than 1 data point in a time period. The values of these points are aggregated and are shown in brown color.
Categorical Signals
A signal which is composed of text (string), boolean type data or
discrete numerical values (i.e. integer or float data which are limited
in the values that they can assume). Examples are: phase number of a
process (1, 2, 3), the position of a switch (open, closed), steel type,
alarm state (true, false), etc., Similar to numerical signals,
categorical signals will show aggregate statistical information when
zoomed out in order for dense data to be interpreted. This is true for
operational signal data as well as model predictions. When a range of a
categorical signal contains different labels, the colors of those labels
will be shown as barber-pole
( ). Each pole will
have up to 4 different colors, representing 4 different labels. If there
are more than 4 labels that occur in that time range then it will
display the first 3 labels and then \"others\".
). Each pole will
have up to 4 different colors, representing 4 different labels. If there
are more than 4 labels that occur in that time range then it will
display the first 3 labels and then \"others\".
When zoomed in further the raw data will display. Individual categorical data points will display as rectangular markers colored to match the labels they represent.
TSI has a concept of Approved and Draft signals to manage the signals. The approved signals are those that are approved by the user with owner/manager role and the time series data gets stored for them. The draft signals are the unapproved signals that are been sent to TSI over a connection but no time series data gets stored for them.
When data starts flowing for a connection that is in production mode,
signals are auto identified based on the
connection settings </cloudbase/Connections>{.interpreted-text
role="doc"}. The newly discovered signals get identified as the draft
signals and a user action is required to approve them. The signal name
and type needs to be verified during this approval process.
Signal Type cannot be changed
After approving the signal, its type cannot be changed later.
To approve signals, go to the All Signals > Draft Signals view UI, validate/change the type using the Edit type action and approve all the signals of interest using the Approve signals action.
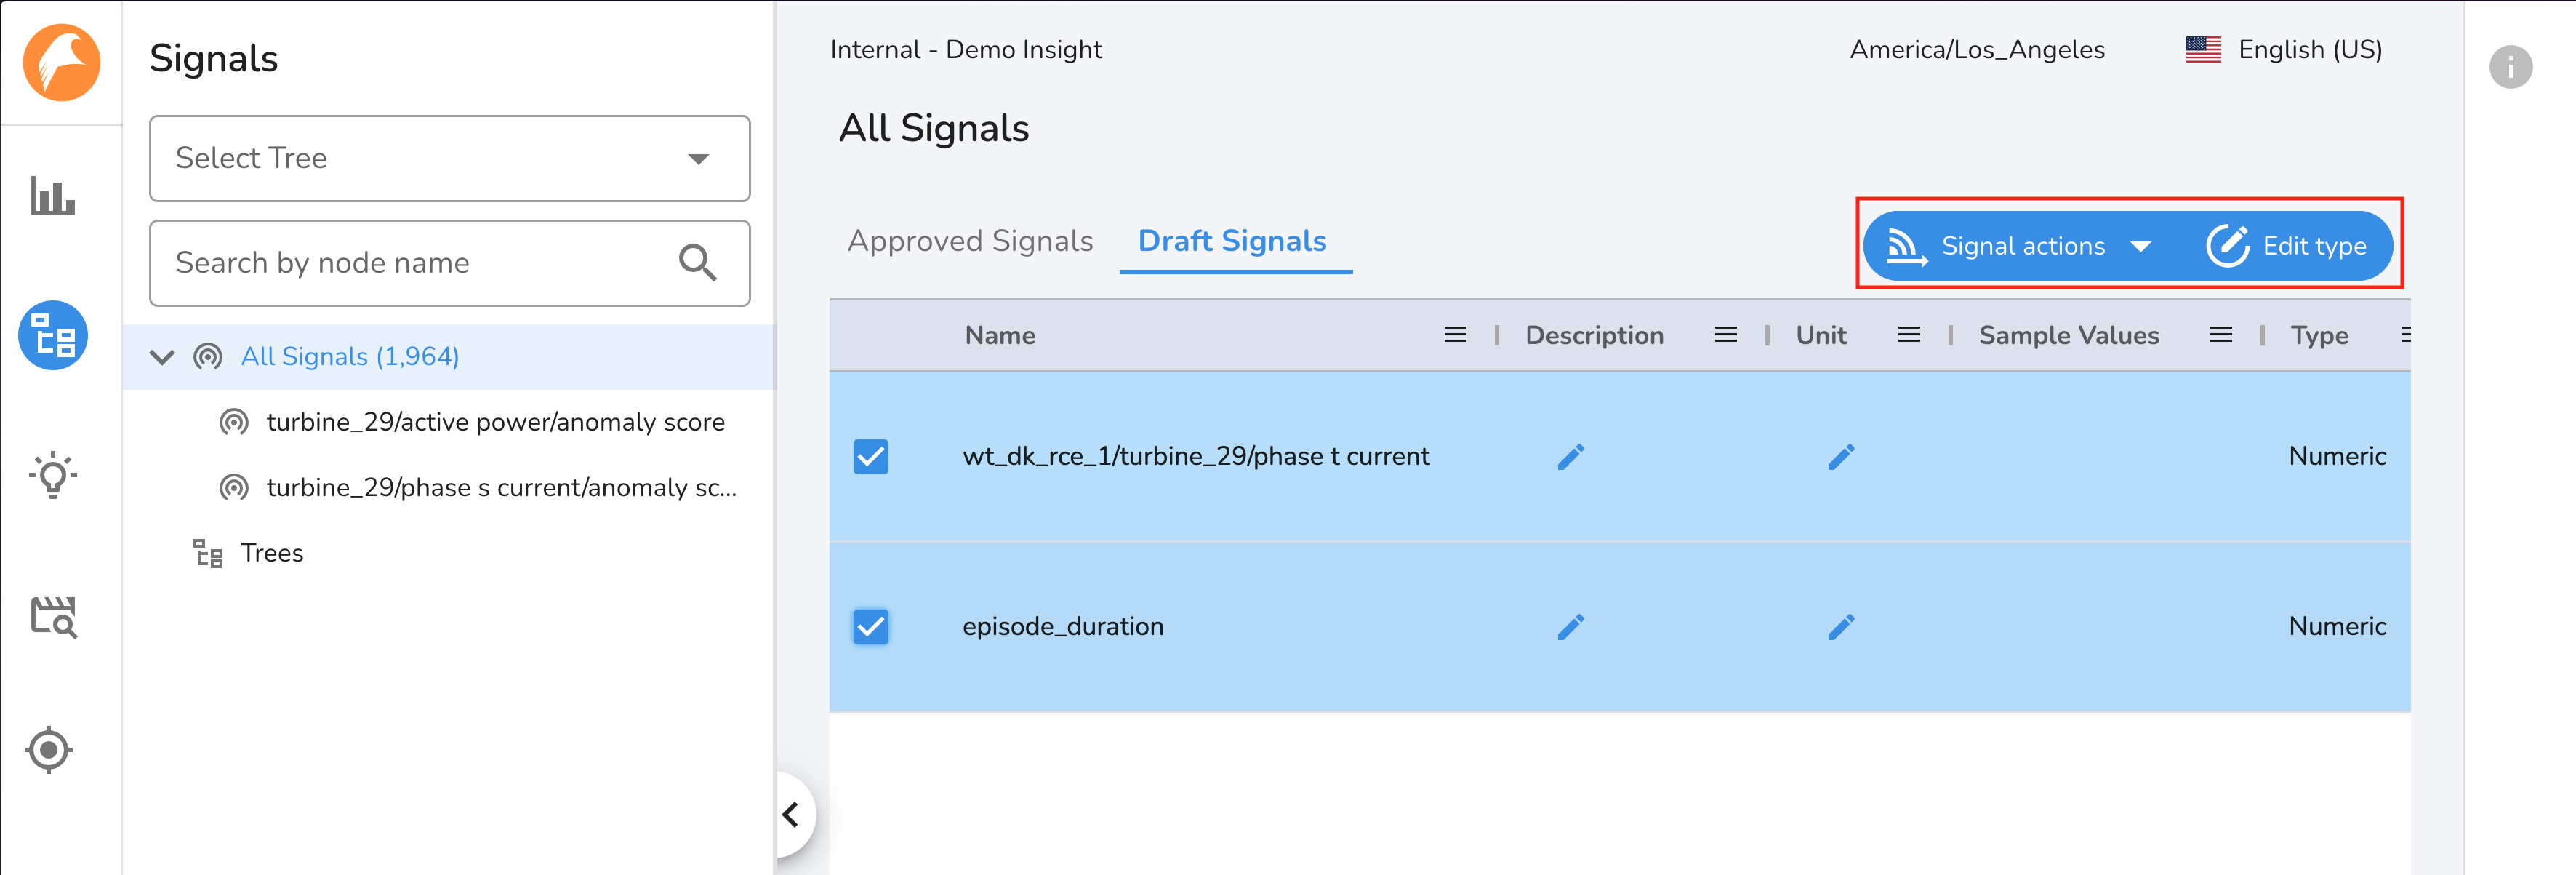
Draft Signals
You may only see limited set of draft signals to approve in the All Signals view. For the initial setup when dealing with thousands of signals, approve signal API can be used to automate the signal approval process.
Handling Signal Name Change
Warning
Currently this feature is only available for iba, File, and Historical Connection with connection type setting set as DEFAULT and incoming data in wide formatted parquet files.
It is expected that the incoming data must have the same signal name as approved in TSI throughout the data connectivity life cycle. In an event this cannot be ensured, TSI allows you to configure and map the new name with the old name for the signals so that the data continues to store within the same signal. The new name does not override the existing signal name in TSI but only gets used during data processing. After the mapping is performed, the incoming data with the new signal name will get processed and stored against the signal that already exists in TSI.
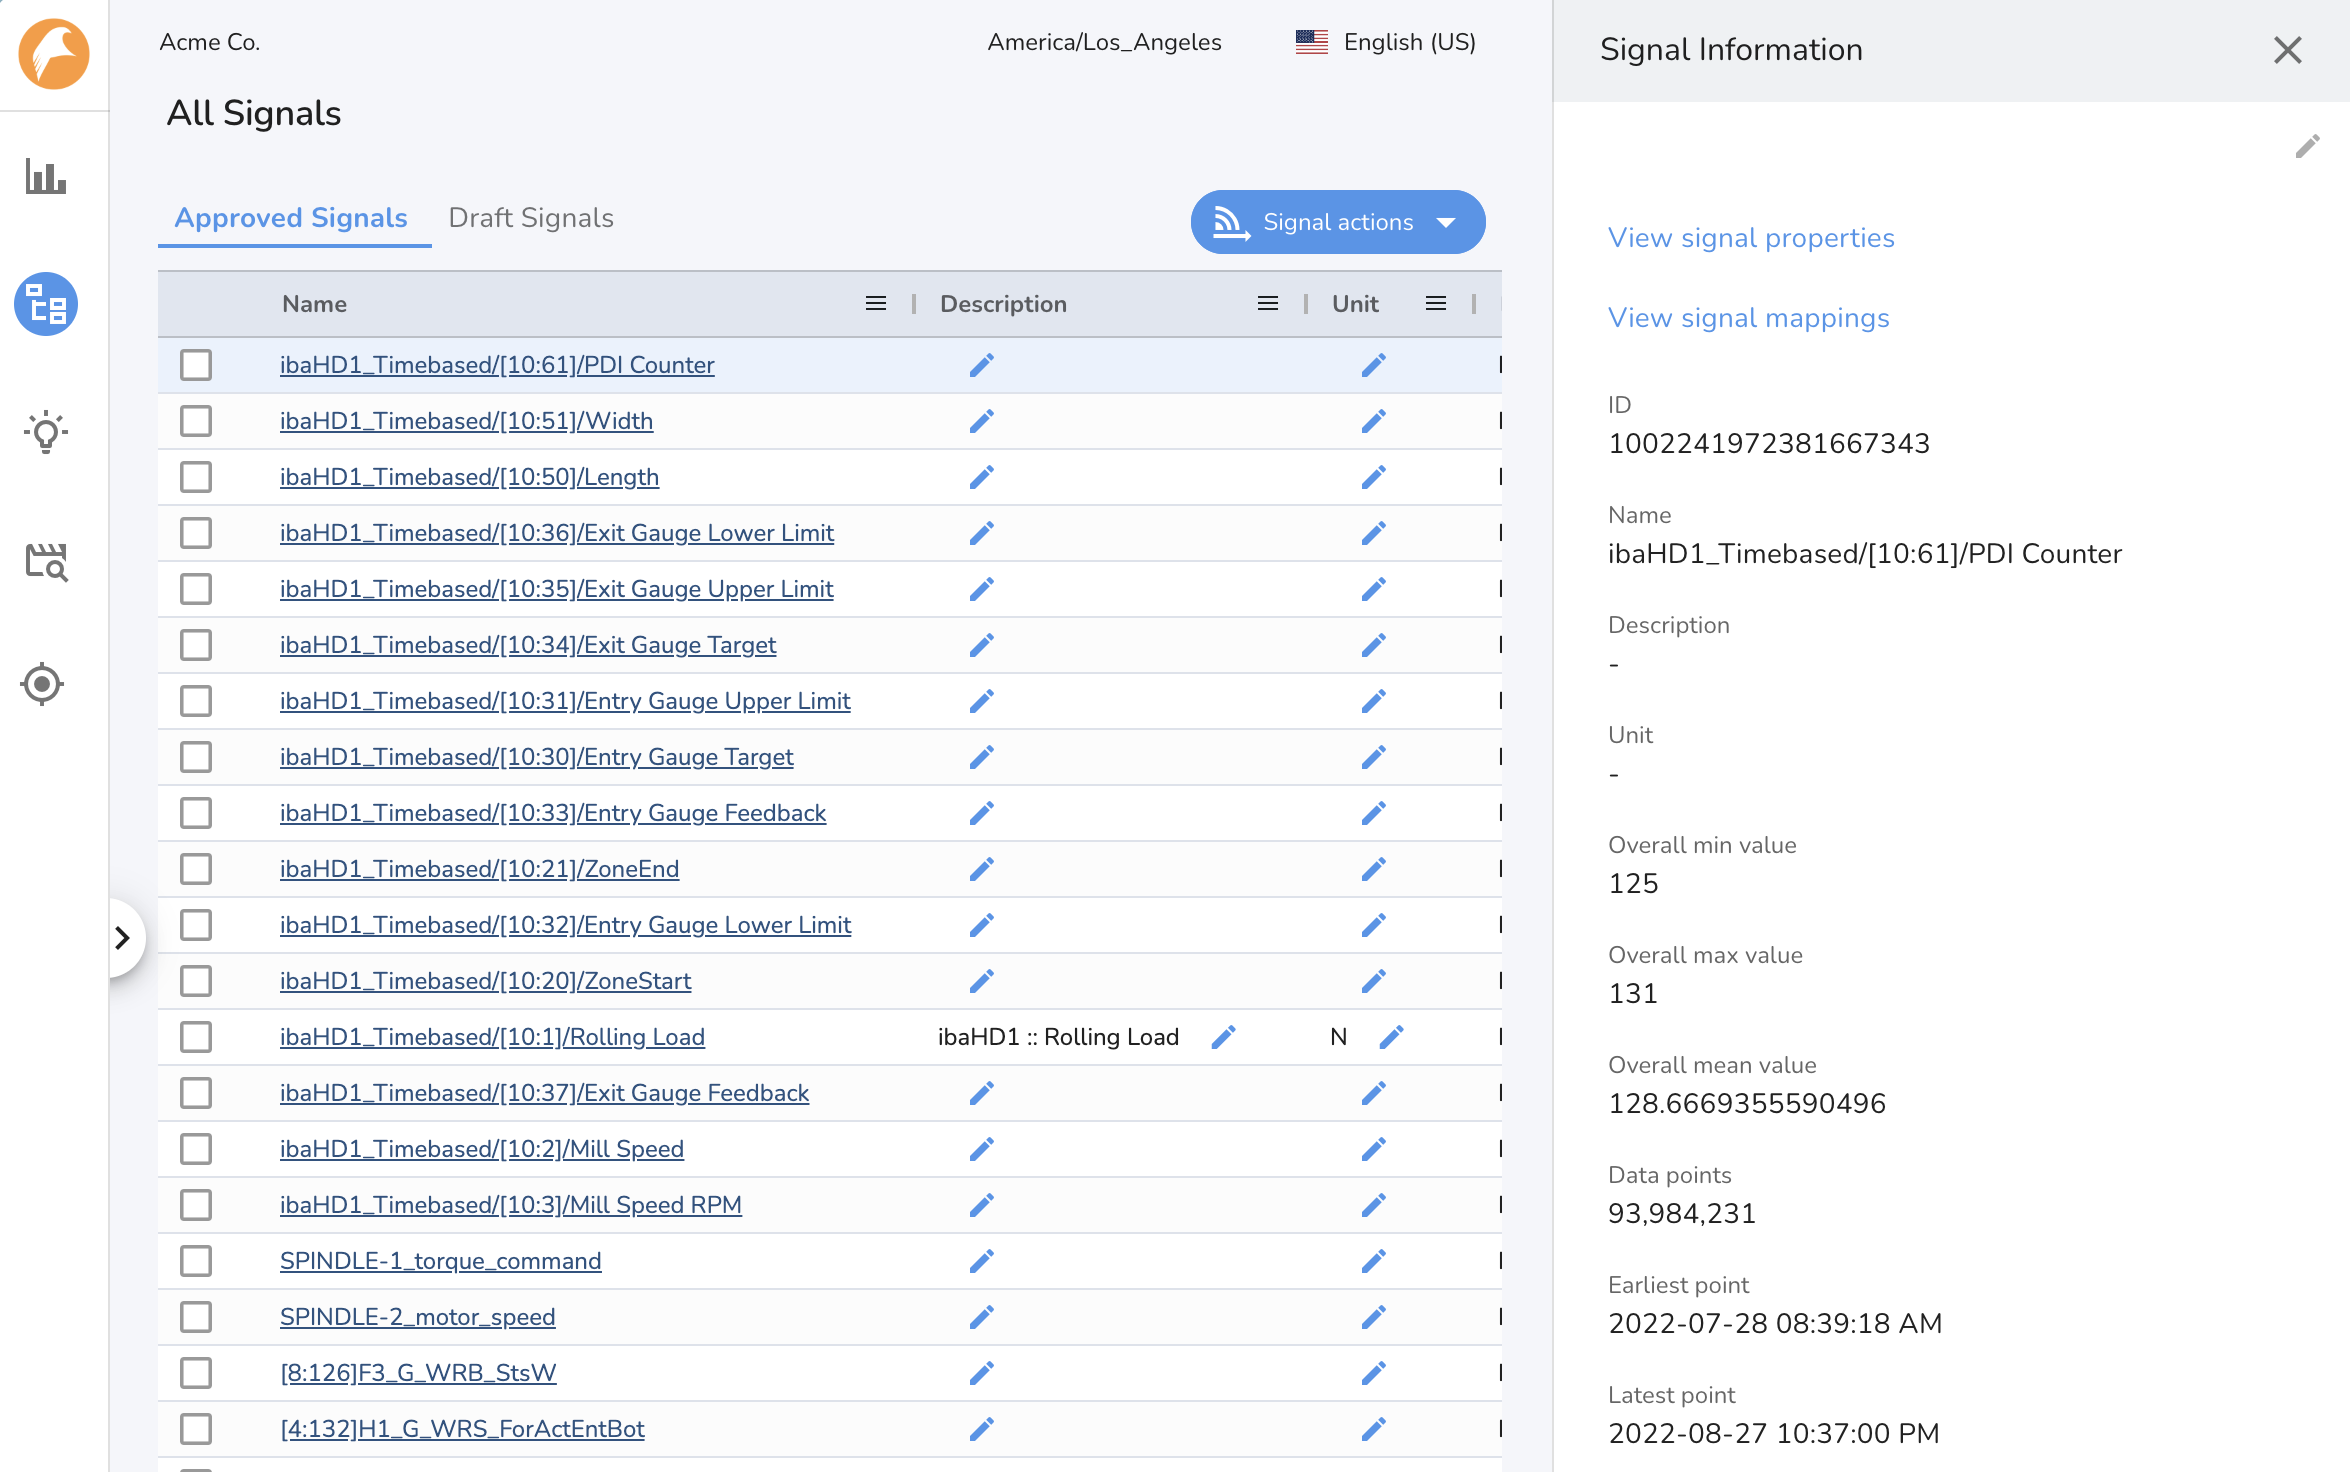
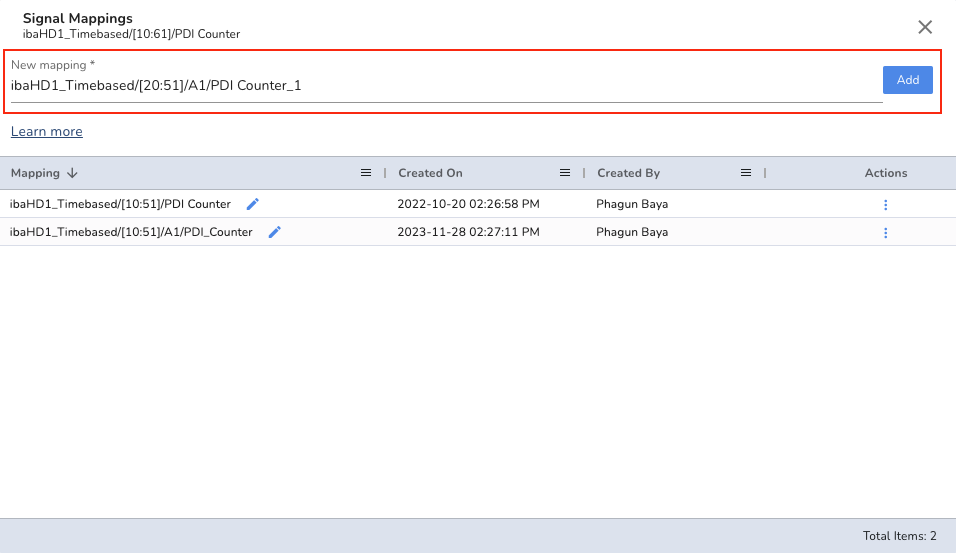
You can map the new signal name via Signal Mapping UI or by importing the metadata file in CSV format. To map an existing signal to a new name, open Signal Info panel and click View Signal Mappings section.
In the Signal Mapping section, type in the new signal name and click Add.
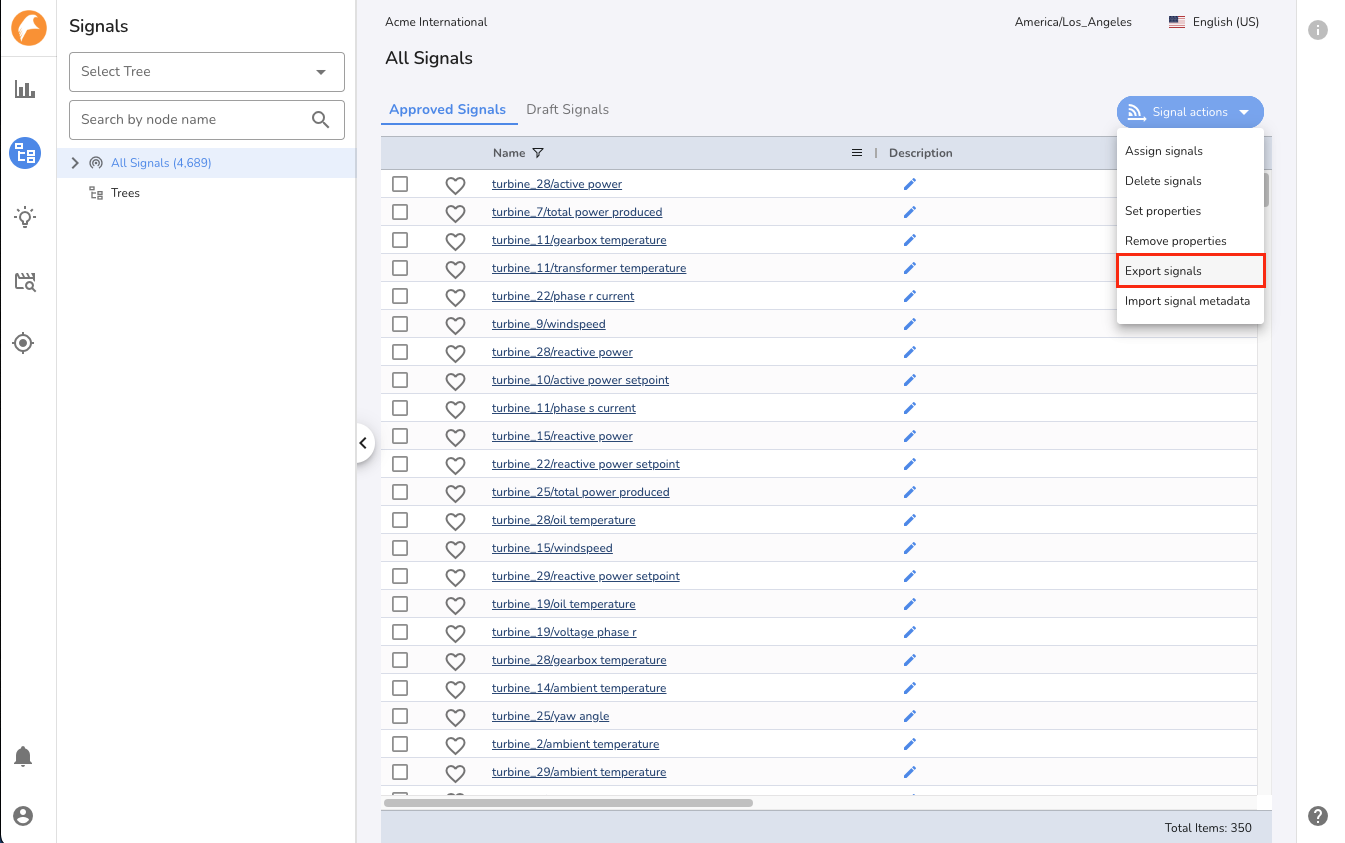
To bulk apply the signal name changes, you can import the signal name mappings via Import Signal Metadata or Mapping action under All Signals section. The mapping file must be CSV formatted with fixed header information as described below:
Note
You can export the signal names by using the Export Signals action from the signal table within the Signal Manager. Make sure the CSV formatted mapping file is valid and has the special characters handled.
| Column Name | Use |
|---|---|
| signalName | Name of the approved signal in TSI. This is a required column. |
| signalMapping | New name of the signal in the external system. Note: If the connection settings have signal name prefix set, you must prefix the new signal name while setting the mapping. |
Template:

signalName,signalMapping
{{current_signal_name}},{{connection_signal_name_prefix}}{{new_signal_name}}

Example:

signalName,signalMapping
ibaHD1_Timebased/[10:61]/PDI_Counter,ibaHD1_Timebased/[10:51]/A1/PDI_Counter
ibaHD1_Timebased/[10:62]/RPM,ibaHD1_Timebased/[10:62]/A1/RPM
Note
You are allowed to add multiple mappings for each signal. The incoming data can have any of the mapping names or the existing signal name.
Importing Signal Metadata and Properties
Signal metadata and properties can be easily imported into TSI for all the approved signals. The metadata information helps in providing additional context to the signals like description, unit, tree assignment and mapping the signal to a new signal name when there is change in sensor or tag name in the external system. And the signal properties are system defined optional configuration to control the signal visualization and behavior.
The metadata information needs to be CSV formatted with fixed header information as described below:
| Column Name | Use |
|---|---|
| signalName | Name of the approved signal in TSI. This is a required column. |
| unit | Unit of measure of the signal in TSI. This is an optional column. |
| description | Description of the signal in TSI. This is an optional column. |
| layout | Name of the Signal Tree. This is an optional column. |
| level[n] | Name of the child node at a given level in the information hierarchy of the Signal Tree. A level[n+1] represents a node within level[n] node. These are optional columns. |
| [signalProperty] | Property to attach to the signal in TSI. Example: minThreshold, maxThreshold, etc. These are optional columns. |
| signalMapping | New name of the signal in the external system. Only set if the incoming data has the signal data with a new name. You can read more here. |
The file must be formatted as below:
signalName,unit,description,layout,level1,level2,minThreshold,signalMapping
signal1,A,measuring current,Turbines,Turbine 1,Outer casing,20,new_signal1
signal2,K,measuring temperature,Turbines,Turbine 1,Outer casing,65,new_signal2
Note
Make sure the CSV is valid and has the special characters handled. If you wish to not set any of the metadata or properties, leave the column blank for those signals. This action triggers SIGNALUPDATE activity. You can monitor the status of this activity under Activities section.
To get the signal list in CSV formatted file, use the Export Signals action from any signal table within Signal Manager. The same CSV file can be reformatted as above to import it back into the system.
Signal Properties
| Property | Use | Applicable In |
|---|---|---|
| sampleInterval | To override system calculated sampling rate for the signal. The value must be ISO 8601 formatted duration. Example: PT1S | Patterns |
| gapThreshold | To define the time interval that should be treated as data gap when signal data is not sent. Last value is repeated until gapThreshold interval. This will override gapThresholdFactor property if set. Typically this should not exceed 8 hours to 1 day. The value must be ISO 8601 formatted duration. Example: P1D | Patterns |
| gapThresholdFactor | To define the signal gap threshold as a factor of sampling rate of the signal or sampleInterval property if set. The factor must be a whole number greater than 1. The value must be an integer. Example: 10 | Patterns |
| windowLowerBound | To override Patterns model window lower bound setting for the signal. The value must be ISO 8601 formatted duration. Example: PT1S | Patterns |
| windowUpperBound | To override the Patterns model window upper bound setting for the signal. The value must be ISO 8601 formatted duration. Example: PT1S | Patterns |
| maxThreshold | To set an upper threshold value for the signal. Displayed as an upper threshold line on the signal chart to see if the signal value is within the limit. The value must be an integer. Example: 100 | Insights, Patterns |
| minThreshold | To set a lower threshold value for the signal. Displayed as a lower threshold line on the signal chart to see if the signal value is within the limit. The value must be an integer. Example: 20 | Insights, Patterns |
Deleting Signal Data
Falkonry Time Series Intelligence is designed to receive large numbers of time series. The Connection settings control the data transformation. When data with incorrect time settings get into a signal, the data becomes unusable. In such case, following REST API can be used to delete a portion of data. This API returns a flow ID and triggers a long running process.
Request Payload
{
  "name": "signaldatacleanup flow",
  "flowType": "SIGNALDATACLEANUP",
  "spec": {
    "sourceIds":["<signal-id>"],
    "startTime": "YYYY-MM-DDTHH:mm:SS.SSSSSSZ",
    "endTime": "YYYY-MM-DDTHH:mm:SS.SSSSSSZ"
  }
}
Example request
::::: tabs ::: code-tab bash
- \$ curl --location --request POST \'https://app3.falkonry.ai/api/1.2/accounts/xxxxxxxxxxxxxxx/flows\' --header \'Authorization: Bearer \<token>\' --header \'Content-Type: application/json\' --data-raw \'{
\"name\": \"signaldatacleanup flow\", \"flowType\": \"SIGNALDATACLEANUP\", \"spec\": { \"sourceIds\": [\"yyyyyyyyyyyy\"], \"startTime\": \"YYYY-MM-DDTHH:mm:SS.SSSZ\", \"endTime\": \"YYYY-MM-DDTHH:mm:SS.SSSZ\" } }\'
:::
::: code-tab python
import requests URL = \'https://app3.falkonry.ai/api/1.2/accounts/xxxxxxxxxxxxxxx/flows\' TOKEN = \'\<token>\' HEADERS = {\'Authorization\': f\'Bearer {TOKEN}\'} PAYLOAD = { \"name\": \"signaldatacleanup flow\", \"flowType\": \"SIGNALDATACLEANUP\", \"spec\": { \"sourceIds\": [\"yyyyyyyyyyyy\"], \"startTime\": \"YYYY-MM-DDTHH:mm:SS.SSSSSSZ\", \"endTime\": \"YYYY-MM-DDTHH:mm:SS.SSSSSSZ\" } }
response = requests.post(URL, headers=HEADERS, data=PAYLOAD) print(response.json()) ::: :::::
Example response
{
  "id": "zzzzzzzzzzzzzz",
  "type": "entities.flow",
  "tenant": "xxxxxxxxxxxxxxx",
  "flowType": "SIGNALDATACLEANUP",
  "status": "CREATED",
  "name": "signaldatacleanup flow",
  "spec": {
    "sourceIds": ["yyyyyyyyyyyy"],
    "startTime": "YYYY-MM-DDTHH:mm:SS.SSSSSSZ",
    "endTime": "YYYY-MM-DDTHH:mm:SS.SSSSSSZ"
  }
}
Note
The startTime and endTime should be in UTC timezone.
The flow takes few minutes to finish. The status should be available under in-app Activity panel.