Signal Tree Management
A Signal Tree (also referred to as a Tree) is a systematic organization of plant-wide signals and associated assets to form maintainable and functional categories. The Signal Tree is used to visualize signal data, set context, and perform analysis on and across assets. Each node in a Signal Tree is uniquely defined and has its own dashboard for visualization. A well organized Signal Tree improves work management by adding metadata information to each signal for the reliability and maintenance teams, as well as providing a micro and macro view of the assets across a plant.
Signal Trees also support rapid reliability improvement by identifying failure trends and likely-to-be-impacted assets. For example, if the bearings failed for one asset, the problem could be the poor quality from a supplier, and hence bearings need to be replaced in all similar assets. TSI supports building many different Signal Trees for the same set of signals, as different tree structures are relevant for different use cases.
Terminology
| Term | Definition |
|---|---|
| Signal Tree | A logical organization of signals and assets. |
| Node | A logical group within a Signal Tree. |
| Child Node | A logical group within a parent group. |
Signal Tree Examples
There are many ways to design a Signal Tree. For example, signals can be organized by asset hierarchy, as suggested by the ISO 14224 standard. Signals can also be organized by location, asset class, sensor type, or failure code based on reliability analysis needs. Here are some examples of the types of Signal Trees that can be created within TSI.
By Asset Hierarchy
Inspired by the ISO 14224 standard, this Signal Tree example systematically classifies business units, processes, systems, and equipment into generic groups. The standard ISO hierarchy suggests nine levels.
The first five levels of the ISO 14224 standard are a high-level categorization that relates to business and plant application regardless of the assets involved. This provides the operating context of the assets for various reliability and maintenance analyses. The levels are:
- Level 1: Industry (required only for multi-industry context)
- Level 2: Business Category
- Level 3: Installation Category
- Level 4: Plant / Unit Category
- Level 5: Section / System
Levels six to nine are related to the assets themselves with further division by parent-child relationships. The levels are:
- Level 6: Asset Class
- Level 7: Sub-unit / Sub-system
- Level 8: Maintainable Item
- Level 9: Part
Note
This Signal Tree organization can be altered to meet the needs of reliability and maintenance. It is not required to have all 9 levels.
Signal Tree Structure:
Industry (Signal Tree)
|-- Business Category
    |-- Installation Category
        |-- Plant / Unit Category
            |-- Section / System
                |-- Asset Class
                    |-- Sub-unit
                        |-- Maintainable Item
                            |-- Part
Example tree
Natural Gas
|-- Upstream
    |-- Drilling
        |-- Plant A01
        |   |-- Compression
        |       |-- Pump P01
        |       |   |-- Lubrication
        |       |       |-- Gearbox G-01
        |       |           |-- Bearing
        |       |               |-- A01_P01_T
        |       |               |-- A01_P01_Vib
        |       |
        |       |-- Pump P02
        |           |-- ...
        |
        |-- Plant A02
            |-- Compression
                |-- Pump P03
                |   |-- Lubrication
                |       |-- Gearbox G-02
                |           |-- Bearing
                |               |-- A01_P02_T
                |               |-- A01_P02_Vib
                |
                |-- Pump P04
                    |-- ...
By Asset Class
This Signal Tree example organizes signals associated with assets by different asset types. This view helps in grouping assets of similar type together for reliability analysis.
Signal Tree Structure
Signal Tree
|-- Asset Class
    |-- Asset
        |-- Sub-unit
Example tree
By Asset Class
|-- Pumps
    |-- Pump P01
    |   |-- Gearbox G-01
    |       |-- A01_P01_T
    |       |-- A01_P01_Vib
    |
    |-- Pump P02
        |-- Gearbox G-02
            |-- A01_P02_T
            |-- A01_P02_Vib
By Asset Location
This Signal Tree example organizes signals associated with assets by their physical location. For assets spread across plants, a geographic view helps in monitoring multiple plants and identifying trends.
Signal Tree Structure
Signal Tree
|-- Country
    |-- State / County
        |-- Plant
            |-- Asset
Example tree
By Location
|-- US
    |-- CA
        |-- Cupertino
        |    |-- Plant A01
        |        |-- Pump P01
        |        |   |-- A01_P01_T
        |        |   |-- A01_P01_Vib
        |        |
        |        |-- Pump P02
        |            |-- A01_P02_T
        |            |-- A01_P02_Vib
        |
        |-- San Jose
            |-- Plant A02
                |-- Pump P03
                |   |-- A01_P03_T
                |   |-- A01_P03_Vib
                |
                |-- Pump P04
                    |-- A01_P04_T
                    |-- A01_P04_Vib
By Sensor Type
This Signal Tree example organizes signals by sensor type. This organization helps in drawing correlations and comparing signals.
Signal Tree Structure
Signal Tree
|-- Sensor Type
Example
By Sensor Type
|-- Temperature
|   |-- A01_P01_T
|   |-- A01_P02_T
|   |-- A01_P03_T
|   |-- A01_P04_T
|
|-- Vibration
    |-- A01_P01_Vib
    |-- A01_P02_Vib
    |-- A01_P03_Vib
    |-- A01_P04_Vib
----------------------There are two methods for creating a Signal Tree, using the Signals UI, or using a CSV file. Step by step instructions for each method follow.
Using Signals
A Signal Tree can be created via the Signals UI by following the steps below.
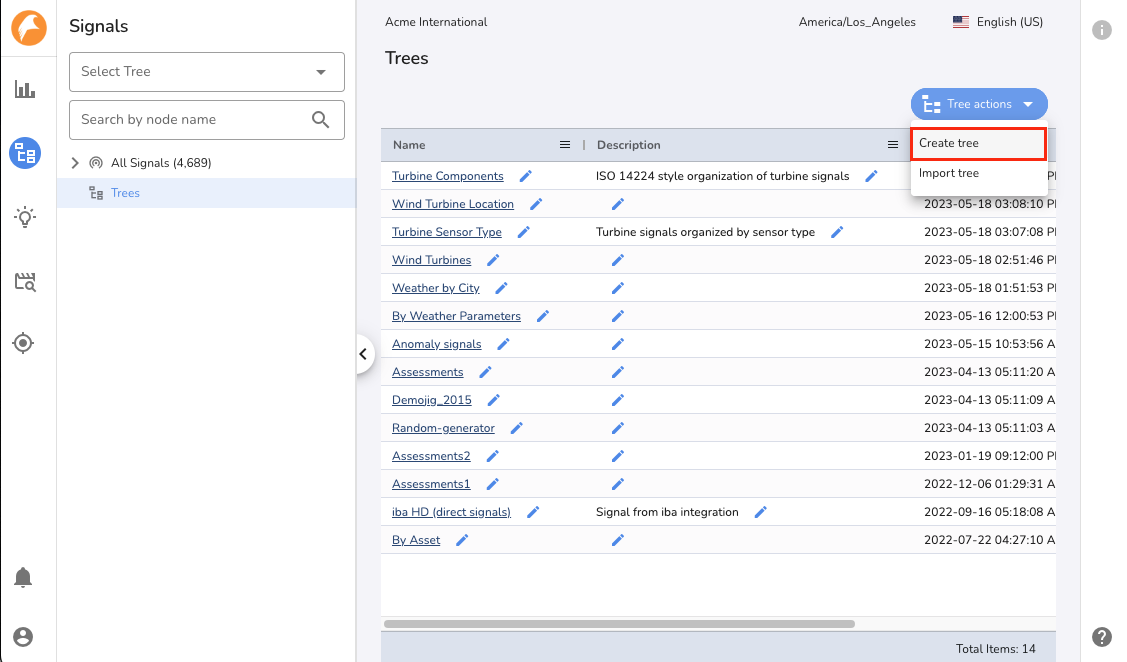
- 1. Create a Tree using the Create Tree action
-
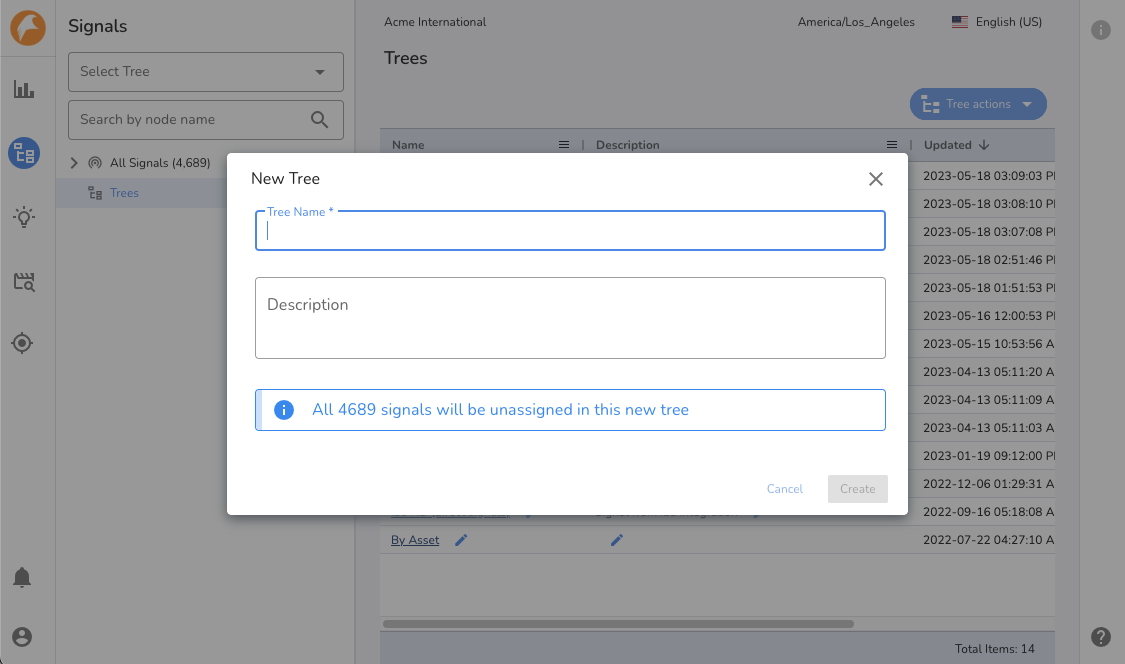
- 2. Give a name and description to the Tree
-
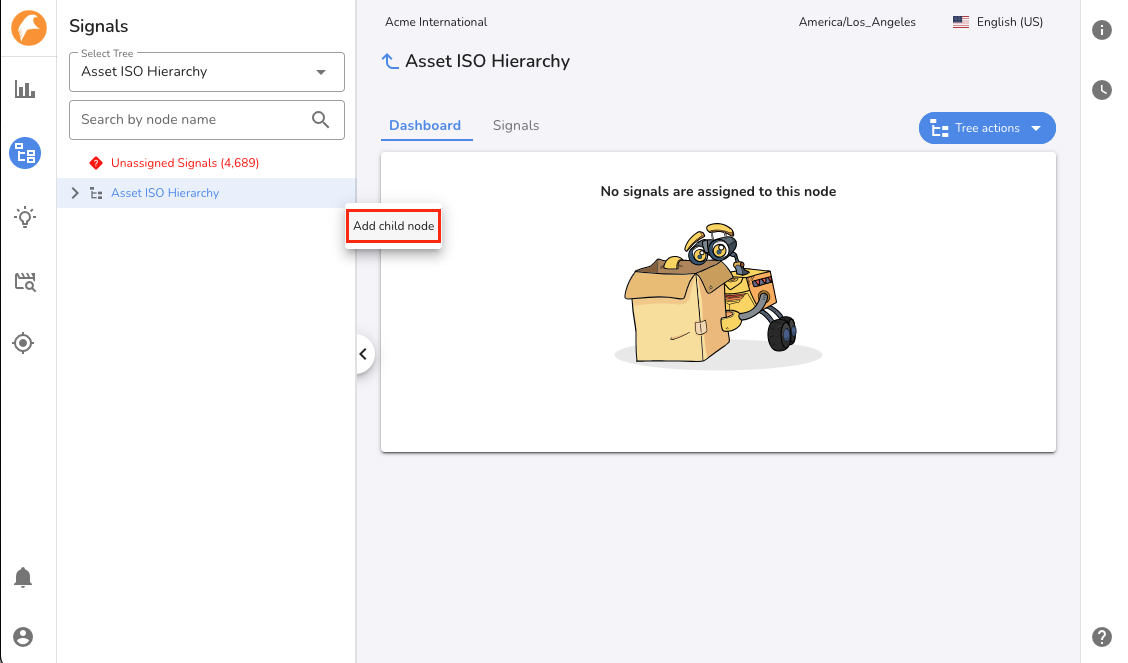
- 3. Add child nodes to the Tree using the Add Child Node action
-
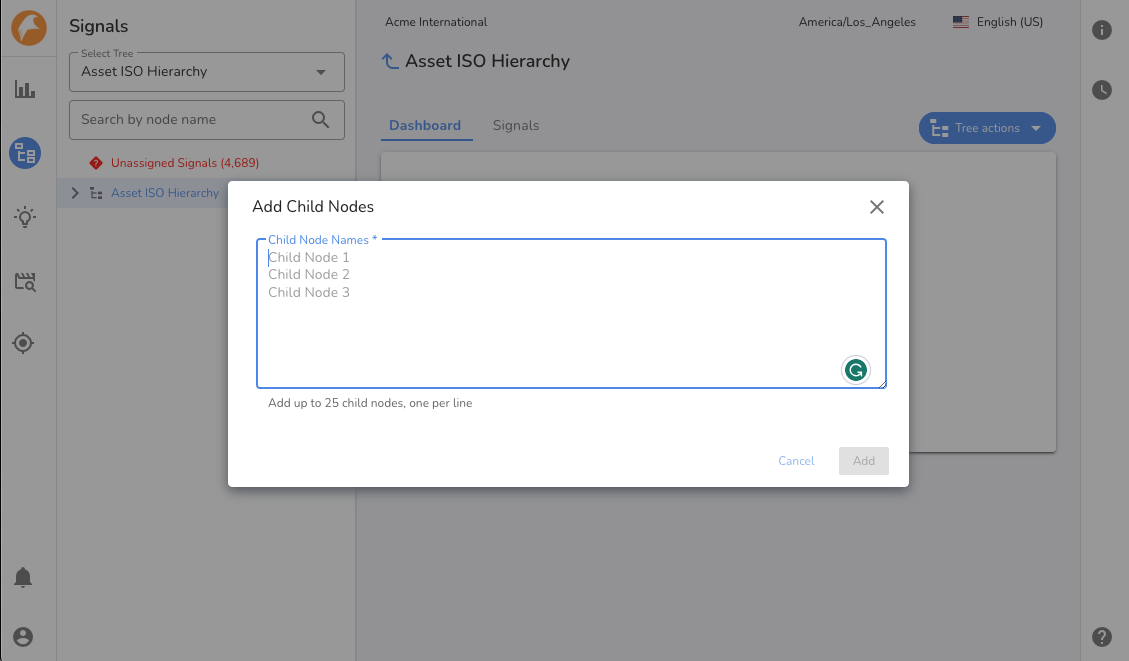
- 4. Type child node names line by line and click the Add button
-
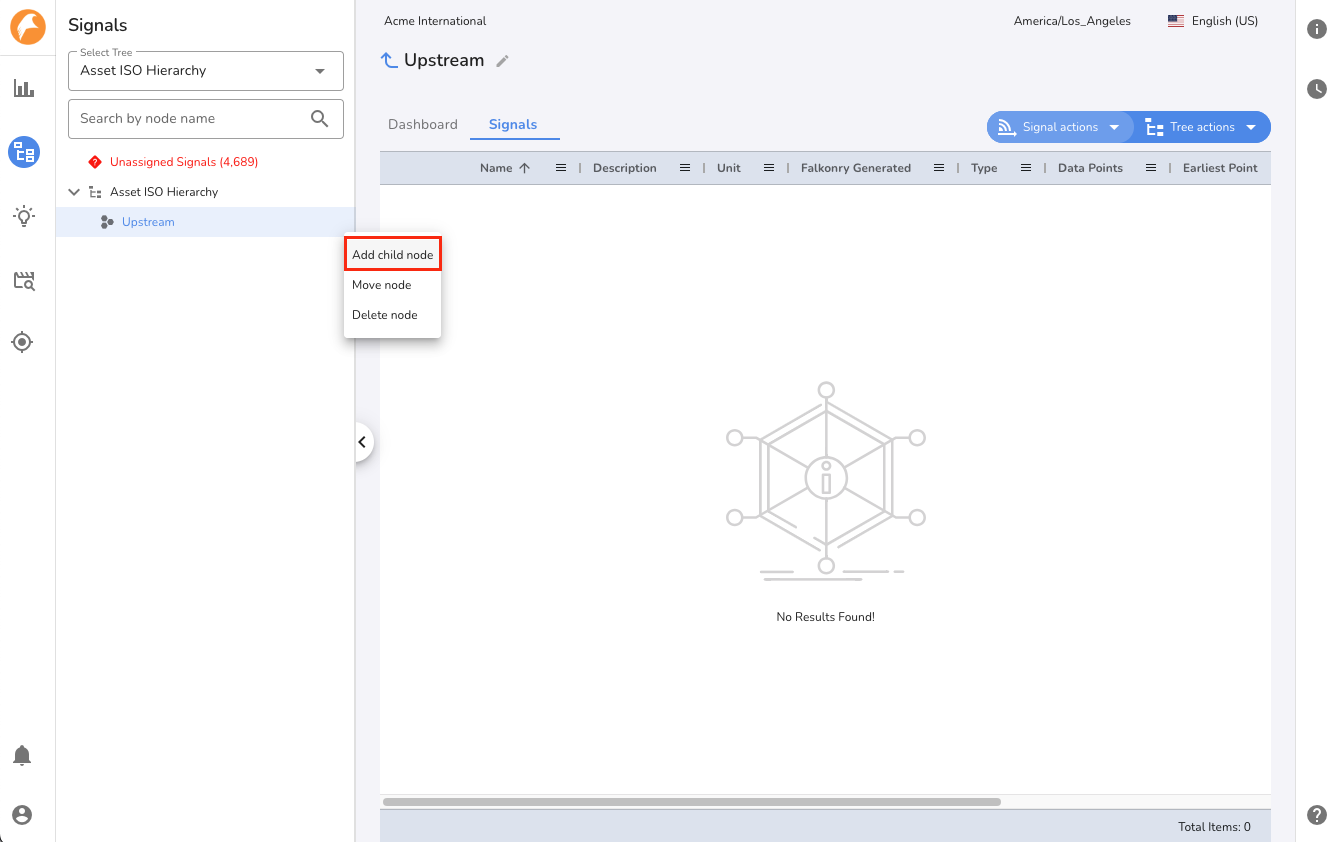
- 5. Click the Add Child Node button corresponding to each node to create its child nodes
-
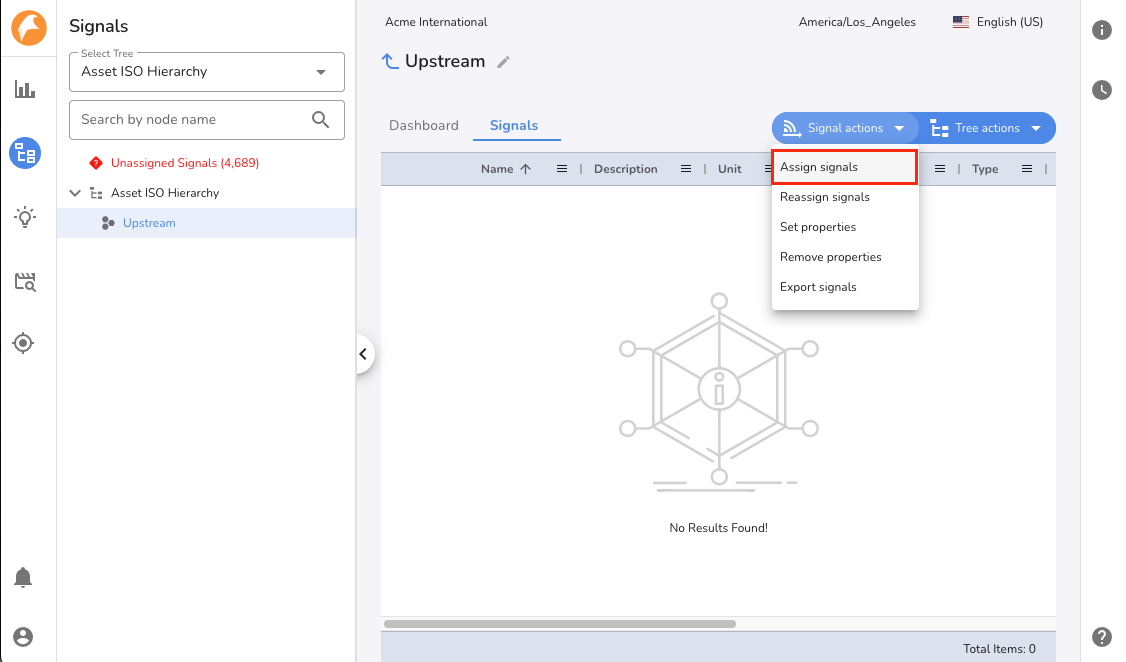
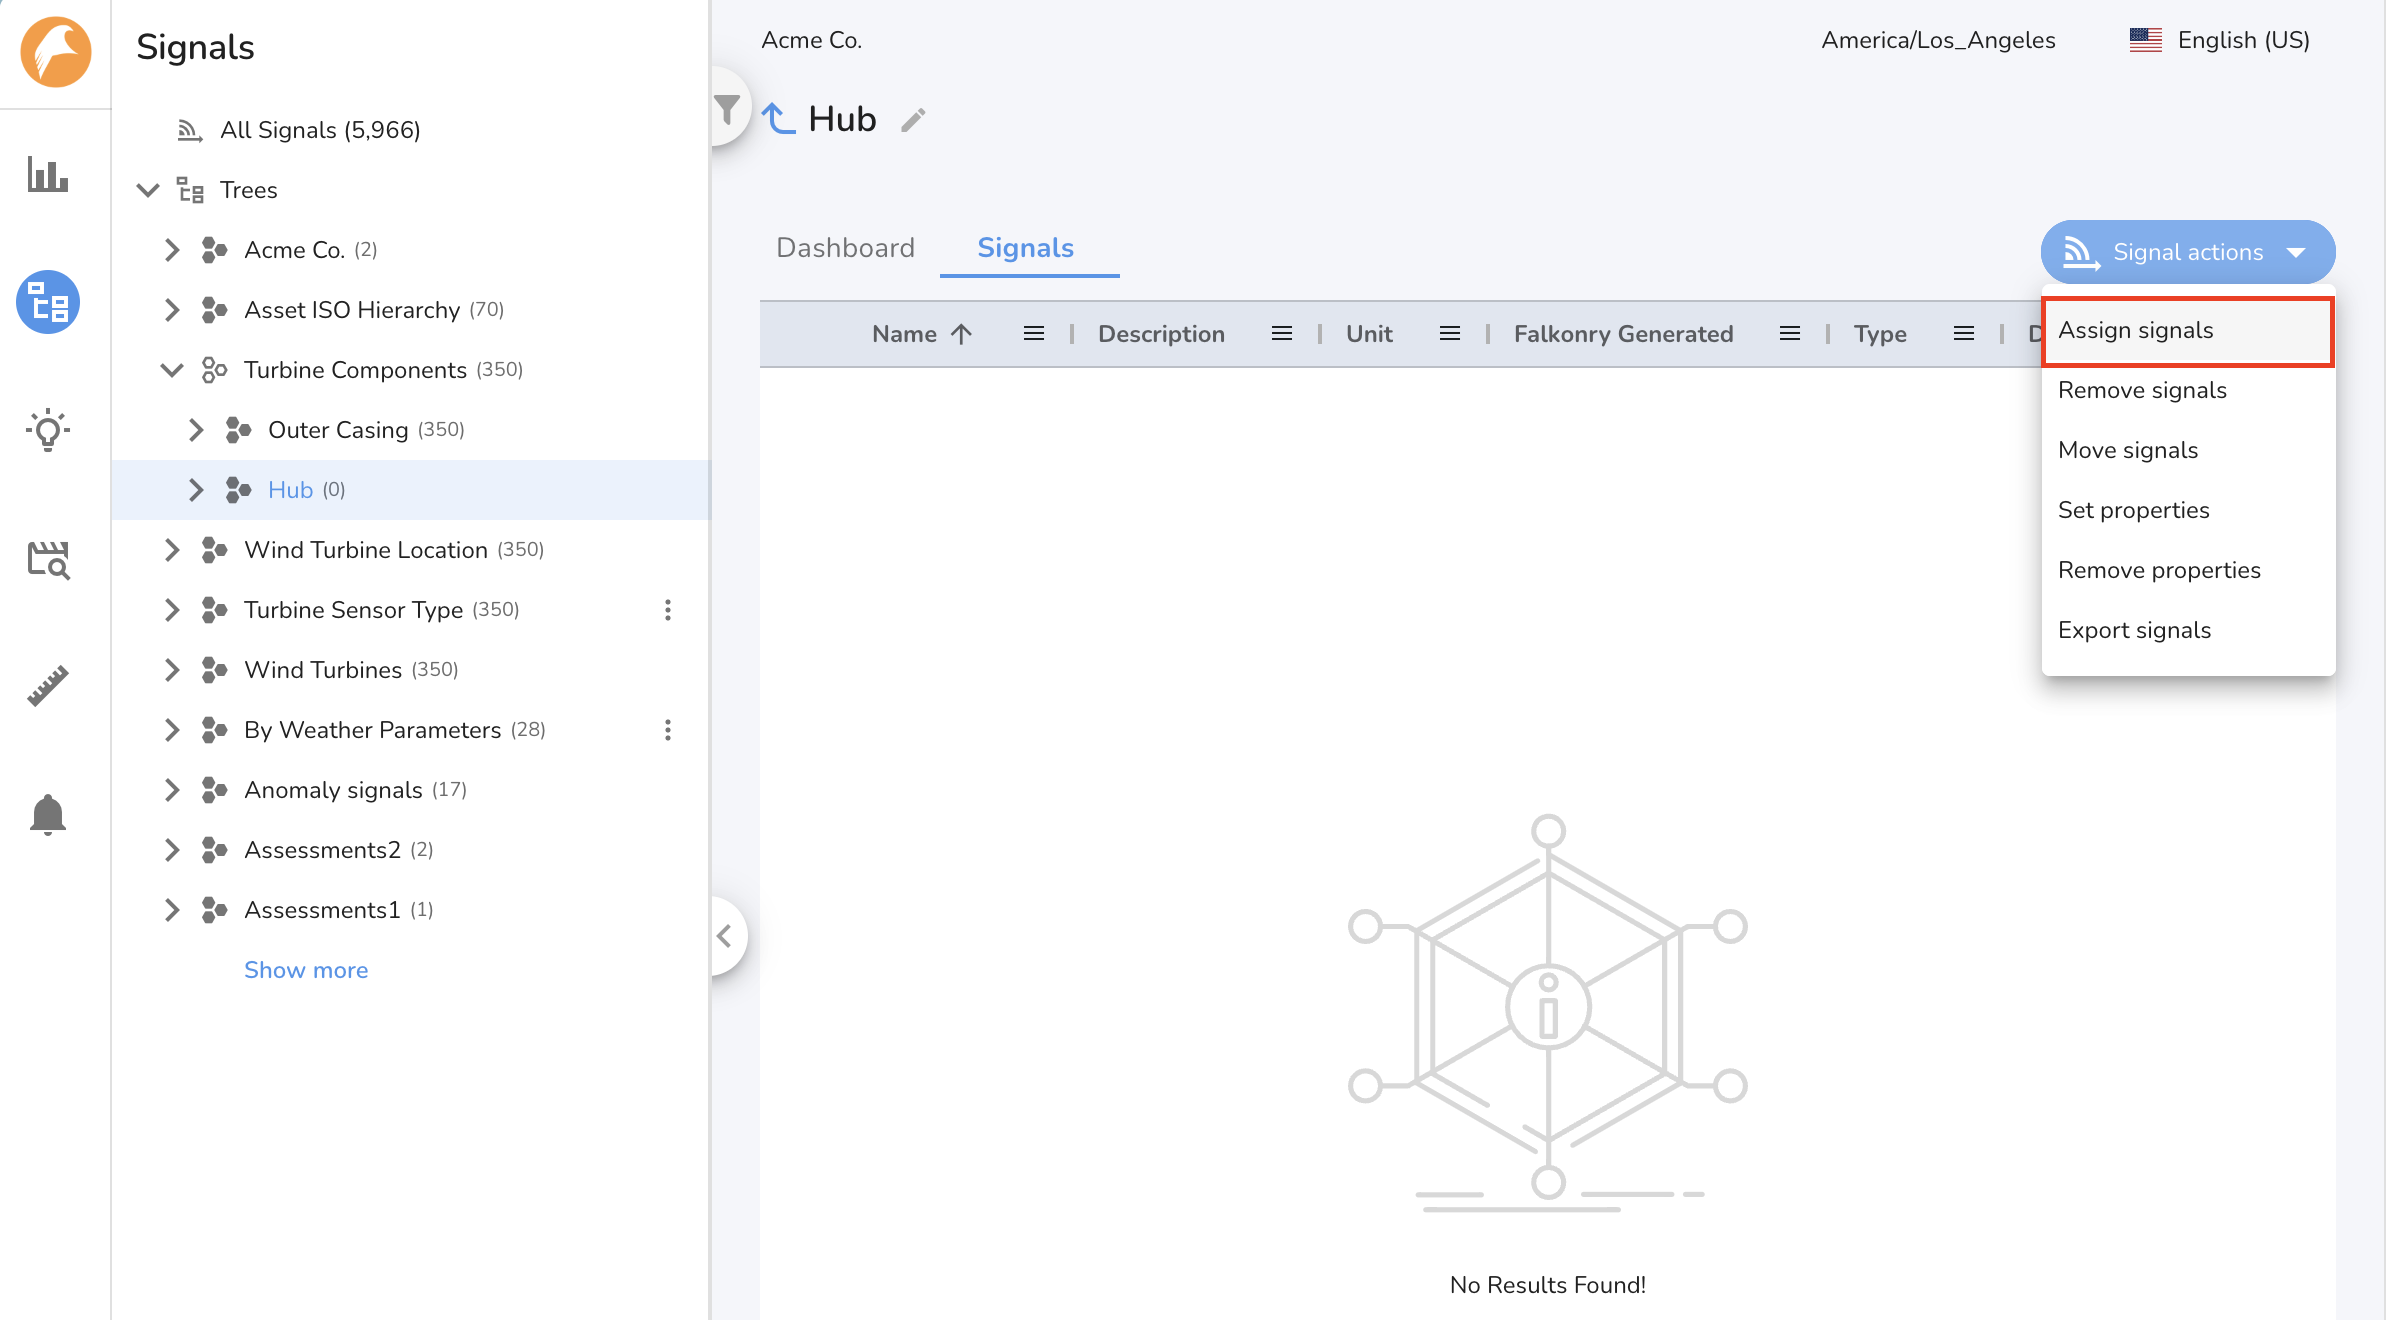
- 6. Go to the child node and start assigning signals using the Assign Signals action
-
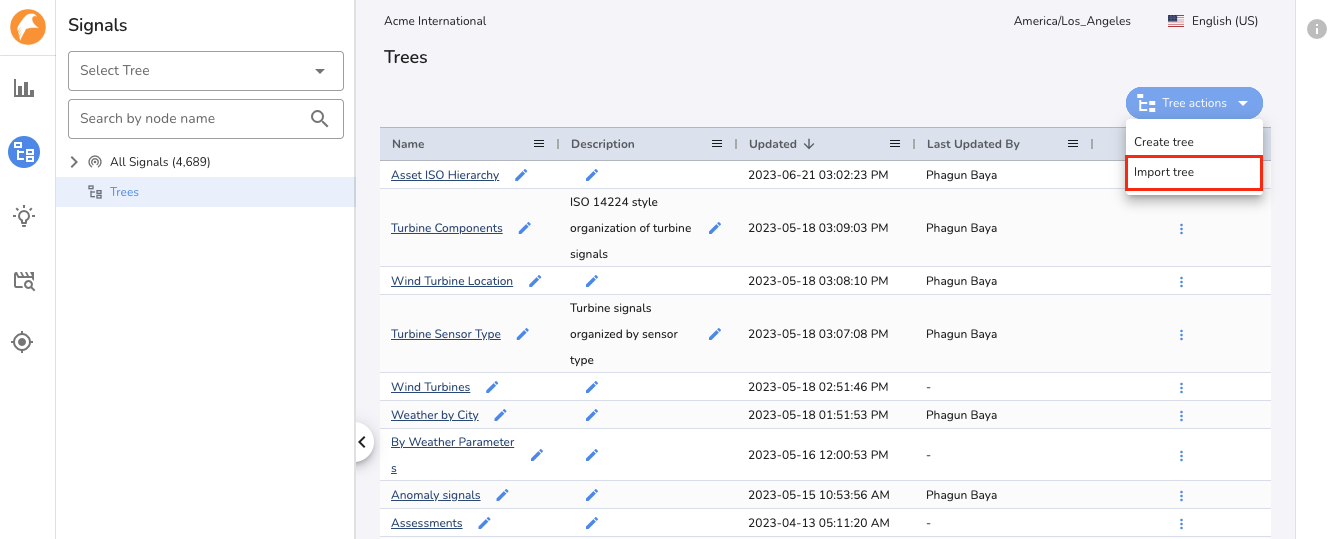
Using a CSV File
Working with thousands of signals can become time critical. For such instances, TSI offers an option to create Signal Trees via file upload using the Import Tree template. The file has a pre-defined structure and needs to be uploaded via the Signals UI. Use the Import Tree action to upload the CSV file.
Required File Format
The file needs to be CSV formatted with fixed header information as described below:
| Column Name | Use |
|---|---|
| signalName | Name of the signal that exists in TSI. This is an optional column. |
| layout | Name of the Signal Tree. This is a required column. |
| level[n] | Name of the child node at a given level in the information hierarchy of the Signal Tree. A level[n+1] represents a node within level[n] node. This is a required column. |
Note
Multiple Signal Trees can be managed with a single file upload. All unique names in the layout column are used to create or update a Signal Tree.
Example
signalName,layout,level1,level2,level3
signal1,By Location,US,CA,Cupertino
signal2,By Location,US,CA,Sunnyvale
,By Plant,EXT_1,Compressor1
,By Plant,EXT_1,Compressor2
The above example will result in two Signal Trees as shown below. By Location and By Plant become the Signal Tree names and levels become the child nodes of the respective Signal Trees. The By Location Signal Tree will have signals assigned to each of the child nodes, whereas the By Plant Signal Tree will not have any signals assigned to nodes.
By Location
    |-- US
        |-- CA
            |-- Cupertino
                  |-- signal1
            |-- Sunnyvale
                  |-- signal2

By Plant
      |-- EXT_1
        |-- Compressor1
  |-- Compressor2
Editing a Tree
There are two methods for editing a Signal Tree, using the Signals UI, or using a CSV file. Step by step instructions for each method follow.
Using the Signals UI
To add signals to a node, simply go to the node and click the Assign Signals action. Then select the signals and click Assign button.
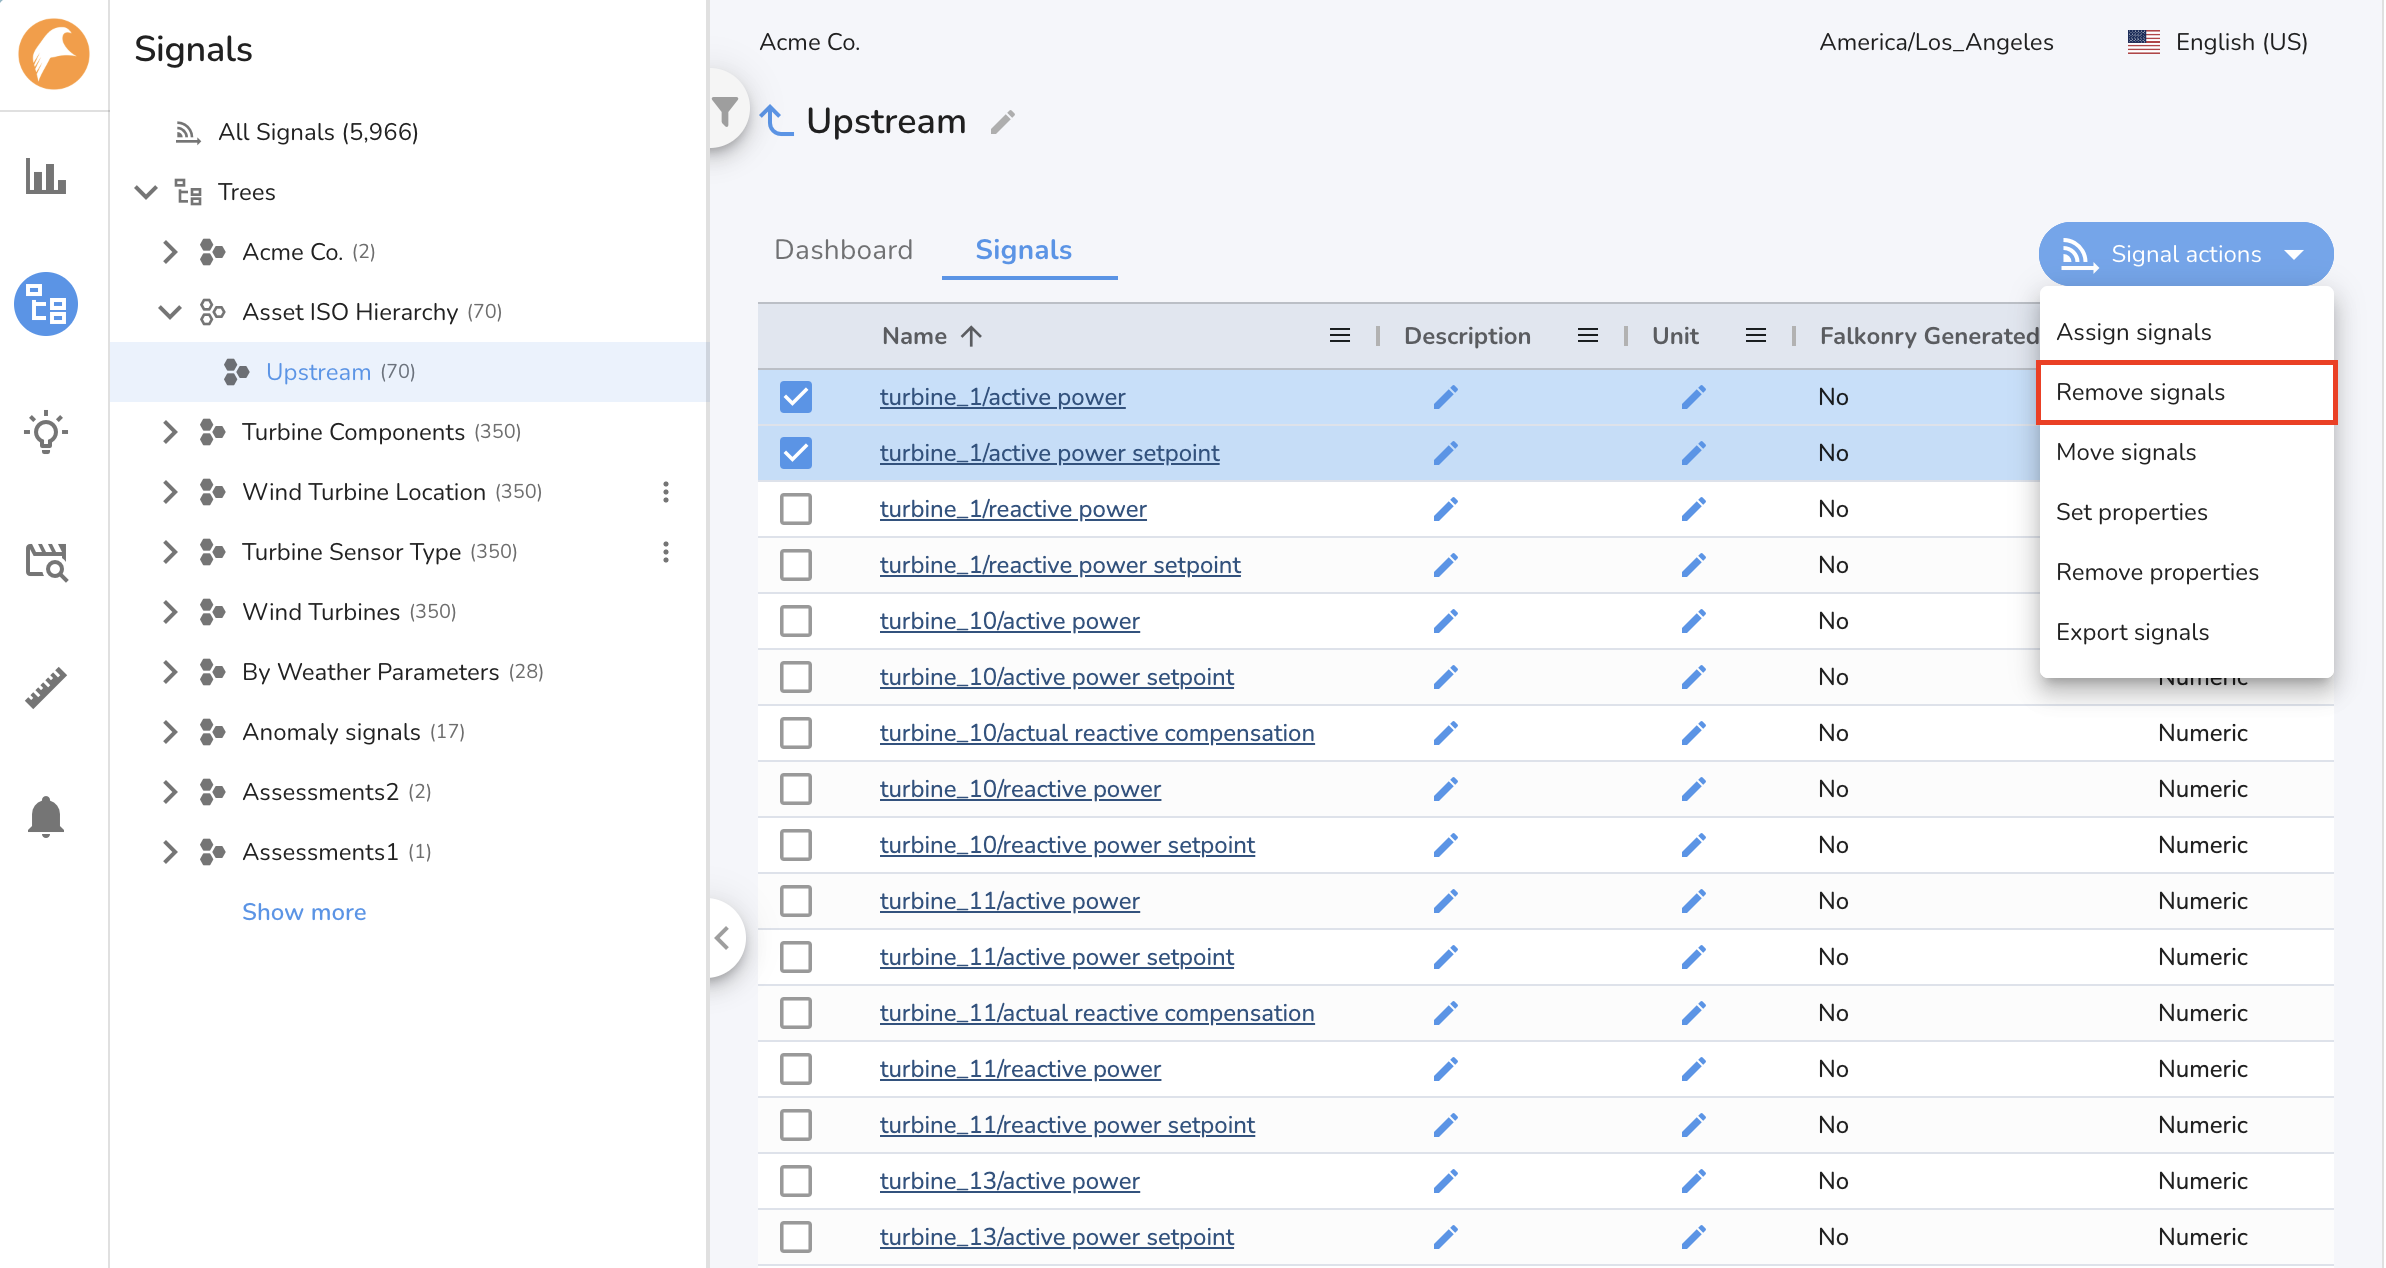
To remove signals already assigned to a node, go to the node and click Remove Signals action.
To move signals from one node to another, go to the node, select signals and click Move Signals action. Then select the target node and click Move button.

Using a CSV File
More signals can be added to new or existing nodes in a Tree via file upload. The file has a pre-defined structure similar to the create tree action and needs to be uploaded from the Signals UI. Use the Import Tree action to upload the CSV file.
Warning
This method cannot be used to remove signals from an assigned node. Use the Signals UI to remove assigned signals from a node as described
here <creating-a-signal-tree>.
Navigating Signal Trees
Falkonry TSI enables you to quickly and easily navigate and search your Signal Trees, no matter their size.
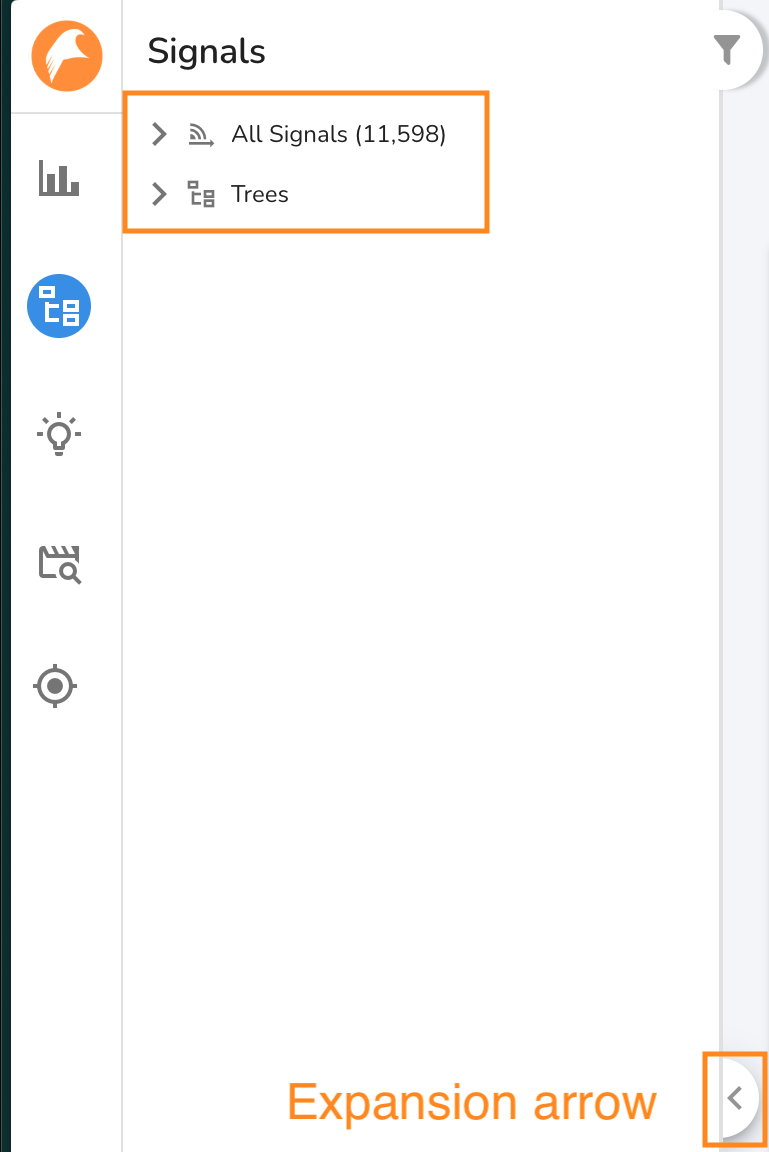
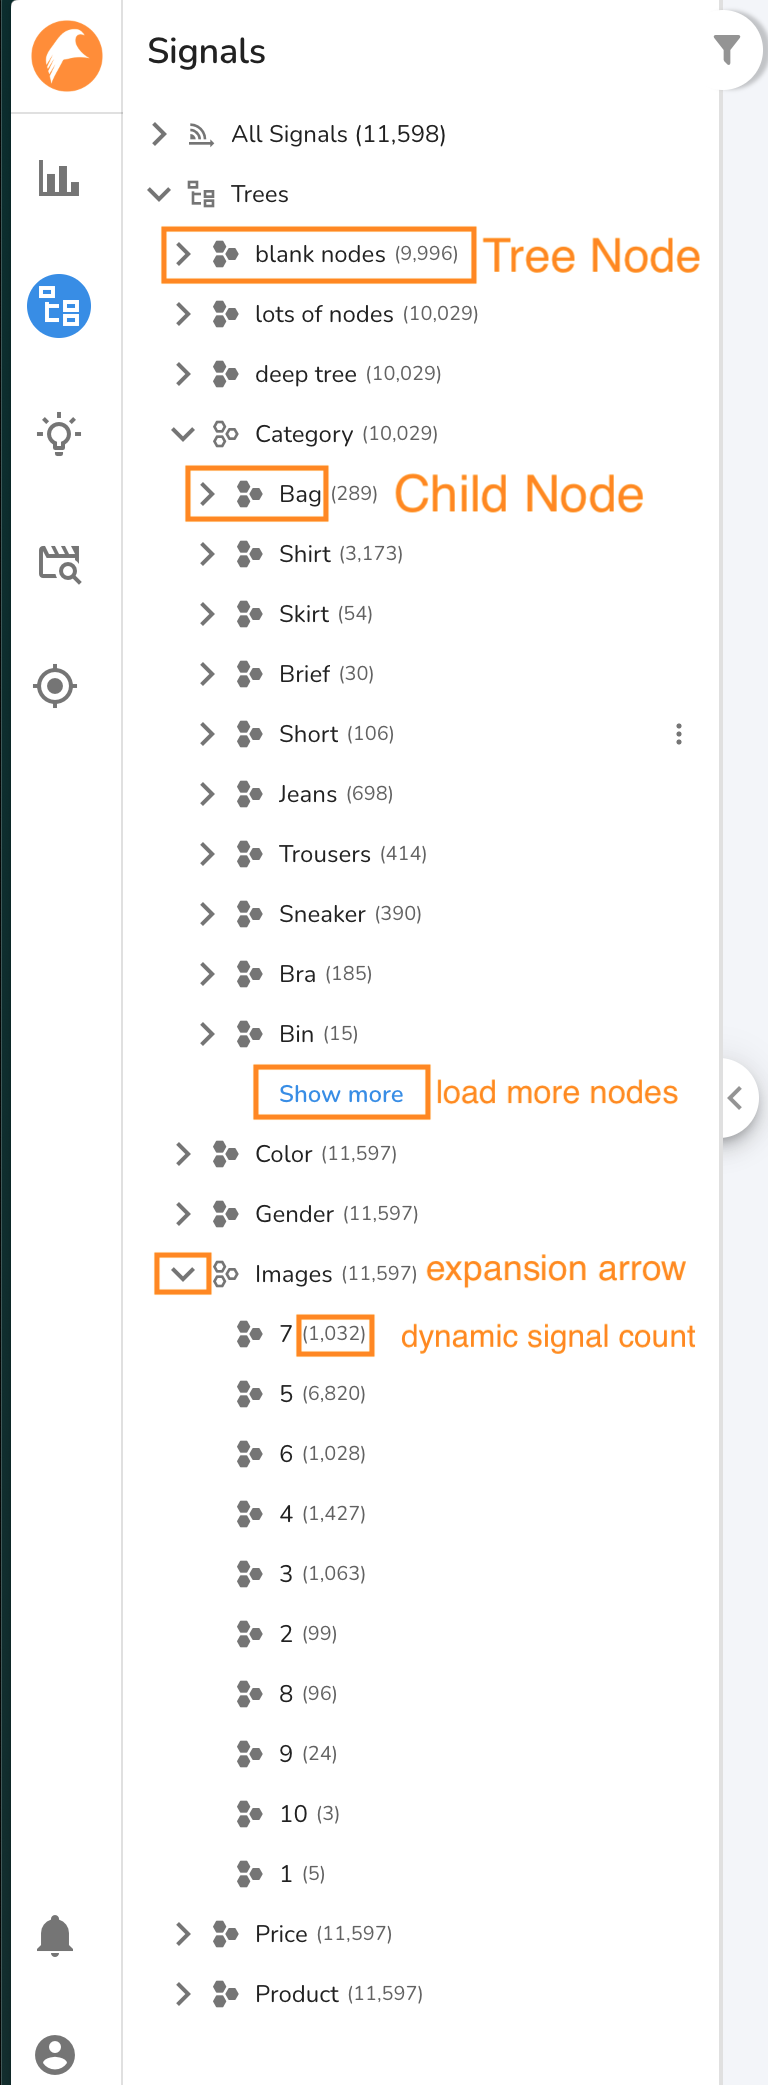
When using the Signals App, you will see the Navigation Panel on the left side of the page. Using the Navigation Panel, you can quickly traverse your Signal Tree Hierarchies to find the Tree Nodes and Signals you are looking for. You can open and close the Navigation Panel by clicking the expansion arrow.
The Navigation Panel has two sections.
- All Signals
- Trees
All Signals Page
The All Signals Node presents all your signals in a single place with no hierarchical information. The All Signals Node has three tabs which provide different views of your signals.
- Dashboard Tab The Dashboard Tab of the All Signals Node displays your signals in timeline charts.
- Signals Tab The Signals Tab displays your signals in a tablular view. In the table you can see metadata about your signals such as the number of datapoints loaded into Falkonry TSI, the earliest and latest point, and more.
- Draft Signals Tab The Draft Signals tab displays the signals which
have been loaded into Falkonry TSI, but not yet approved for ongoing
ingestion and processing. To learn more about draft signals click
here <approving-signal-in-falkonry>.
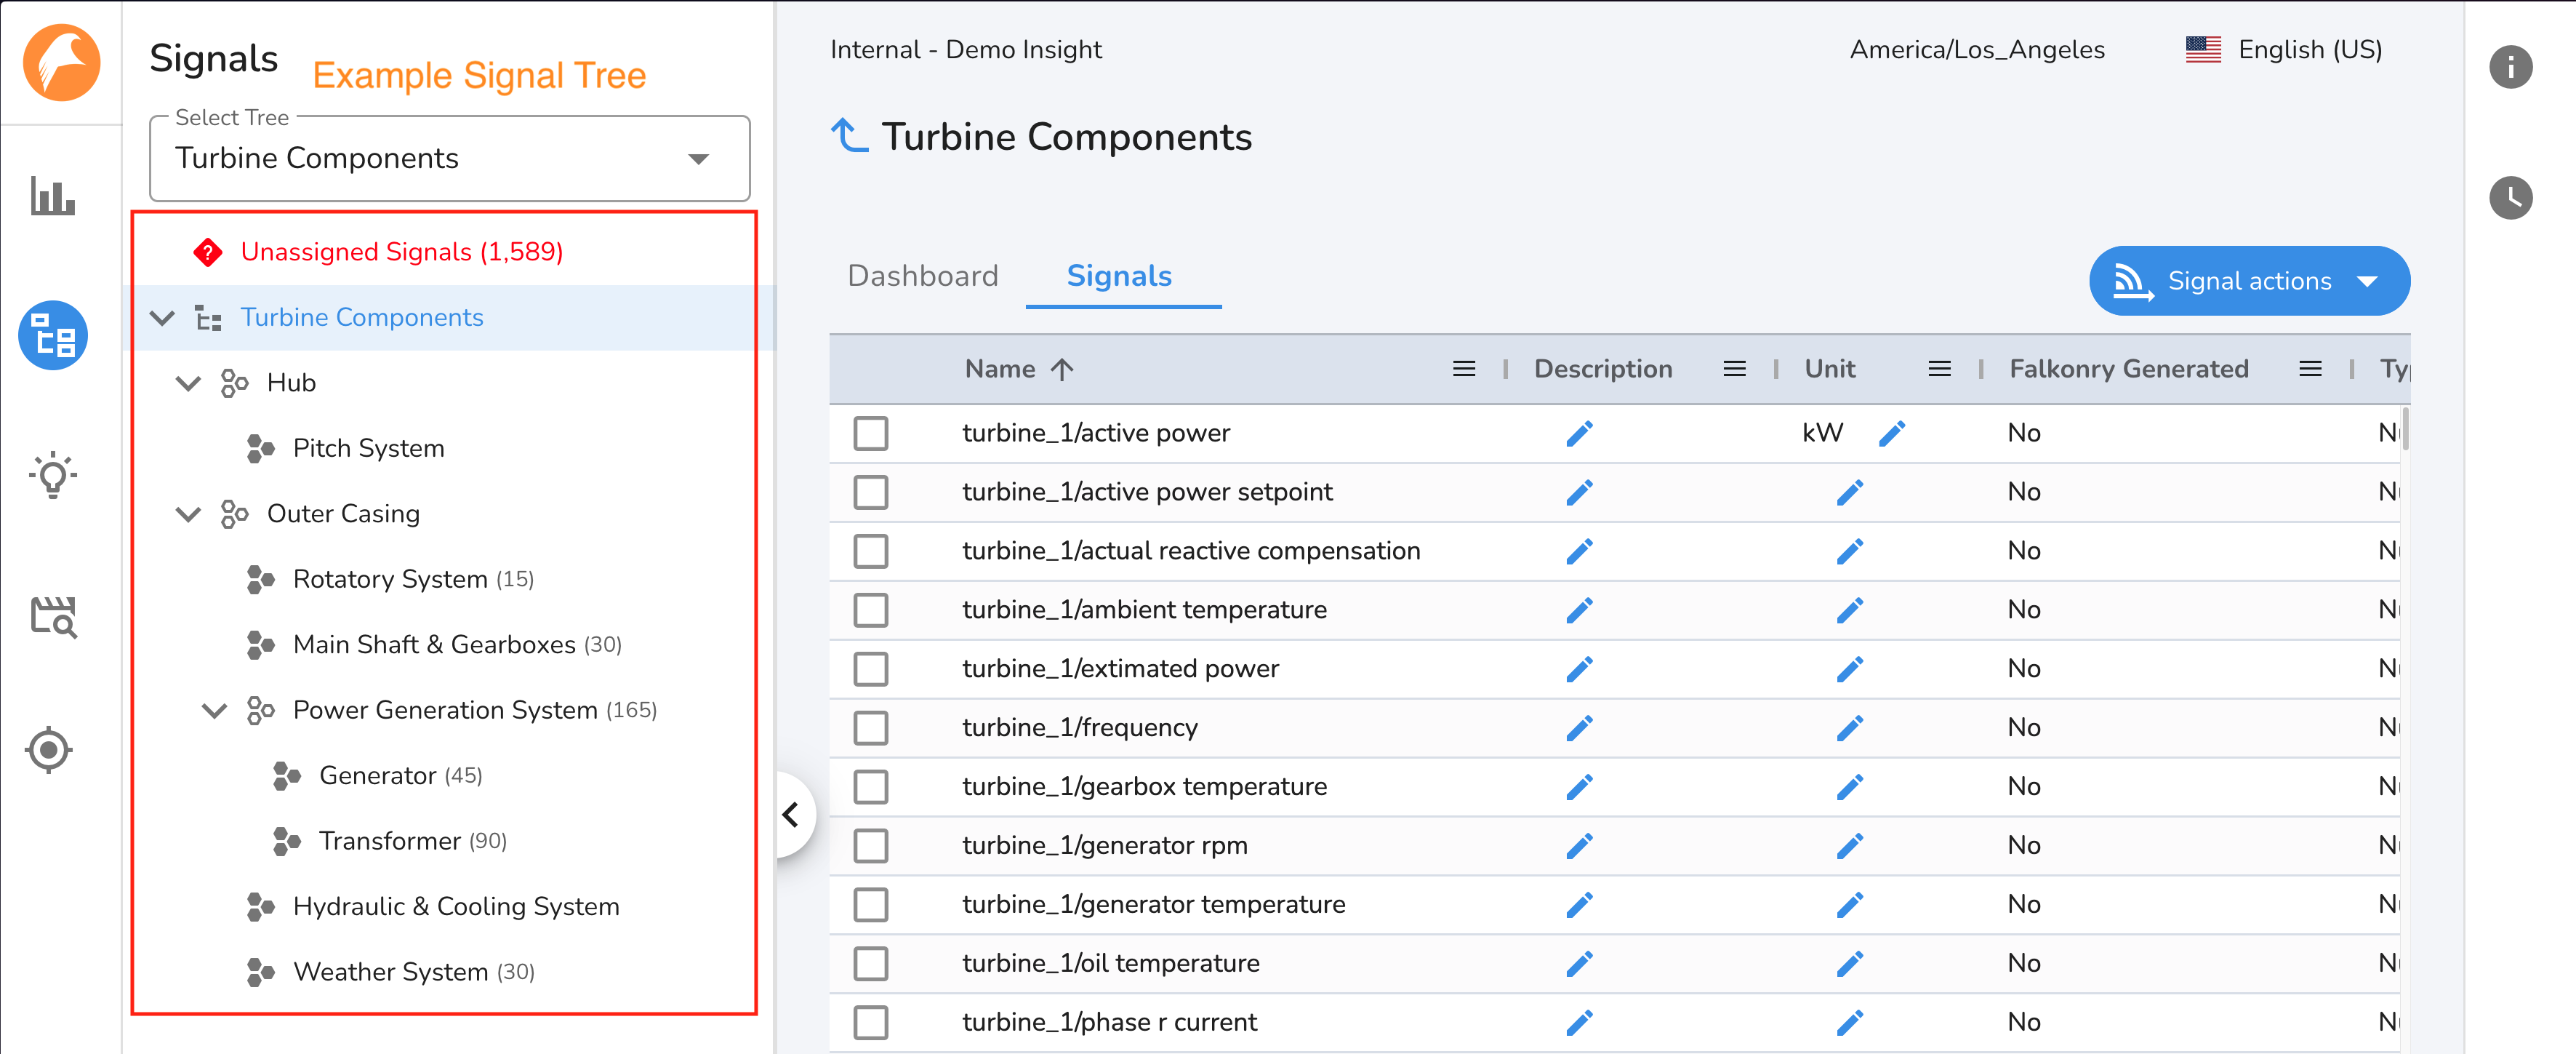
Tree Nodes Pages
Navigation
The first 10 trees are shown in the Navigation Panel below the All Signals node. If you have more than 10 Trees, a show more link is displayed. Clicking on the show more link will load 10 additional trees. To see nodes within a hierarchy, click the expansion arrow for that node and up to 10 child nodes will load. If there are more than 10 nodes in the hierachy, a show more link will appear. Clicking the show more link will load 10 additional nodes. You may expand nodes from different hierarchies, or different parts of one hierarchy, simultaneously. More than one show morelink may be visible in the naviagation pane at a given time.
Each node displays a dynamic count of the number of signals assocated with the node and its child nodes. This number will update as you expand the tree, or filter signals via attribute search.
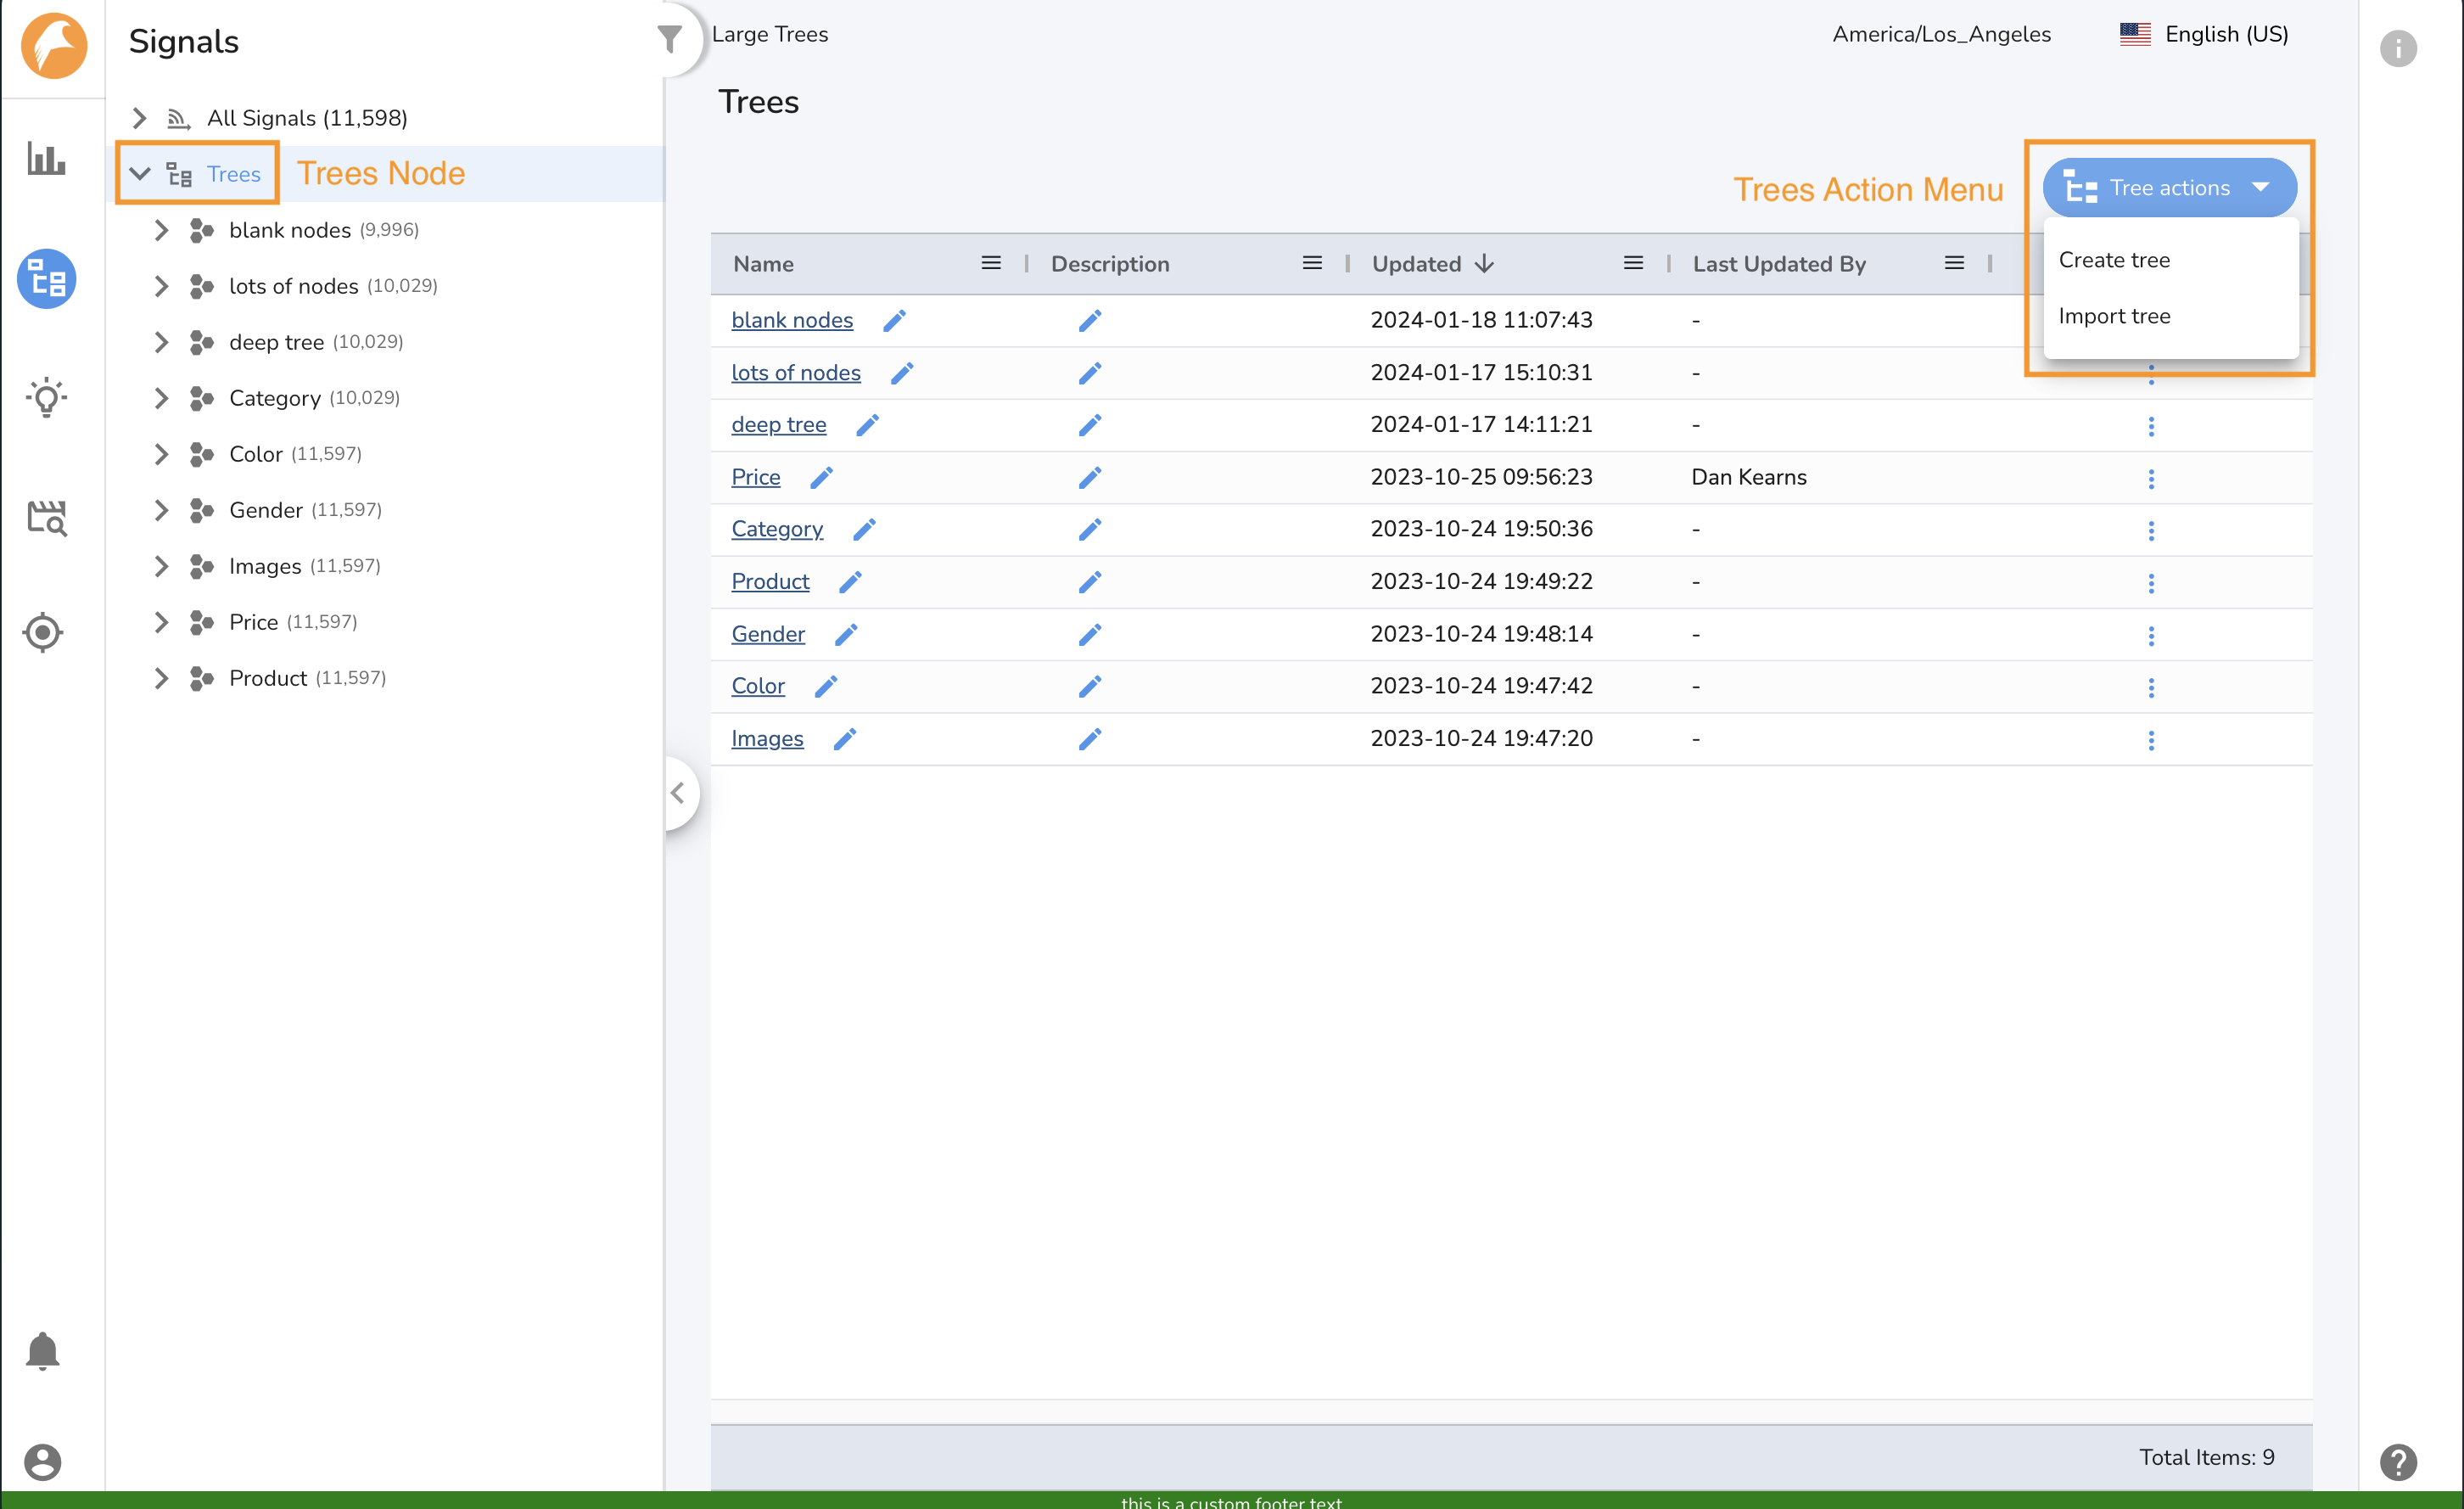
Trees Page
Clicking on the Tree Node will load the Tree page. The Tree page enables
you to modify and create Trees. To learn more about creating and editing
Trees, click here <creating-a-signal-tree>{.interpreted-text
role="ref"}.
Node Page
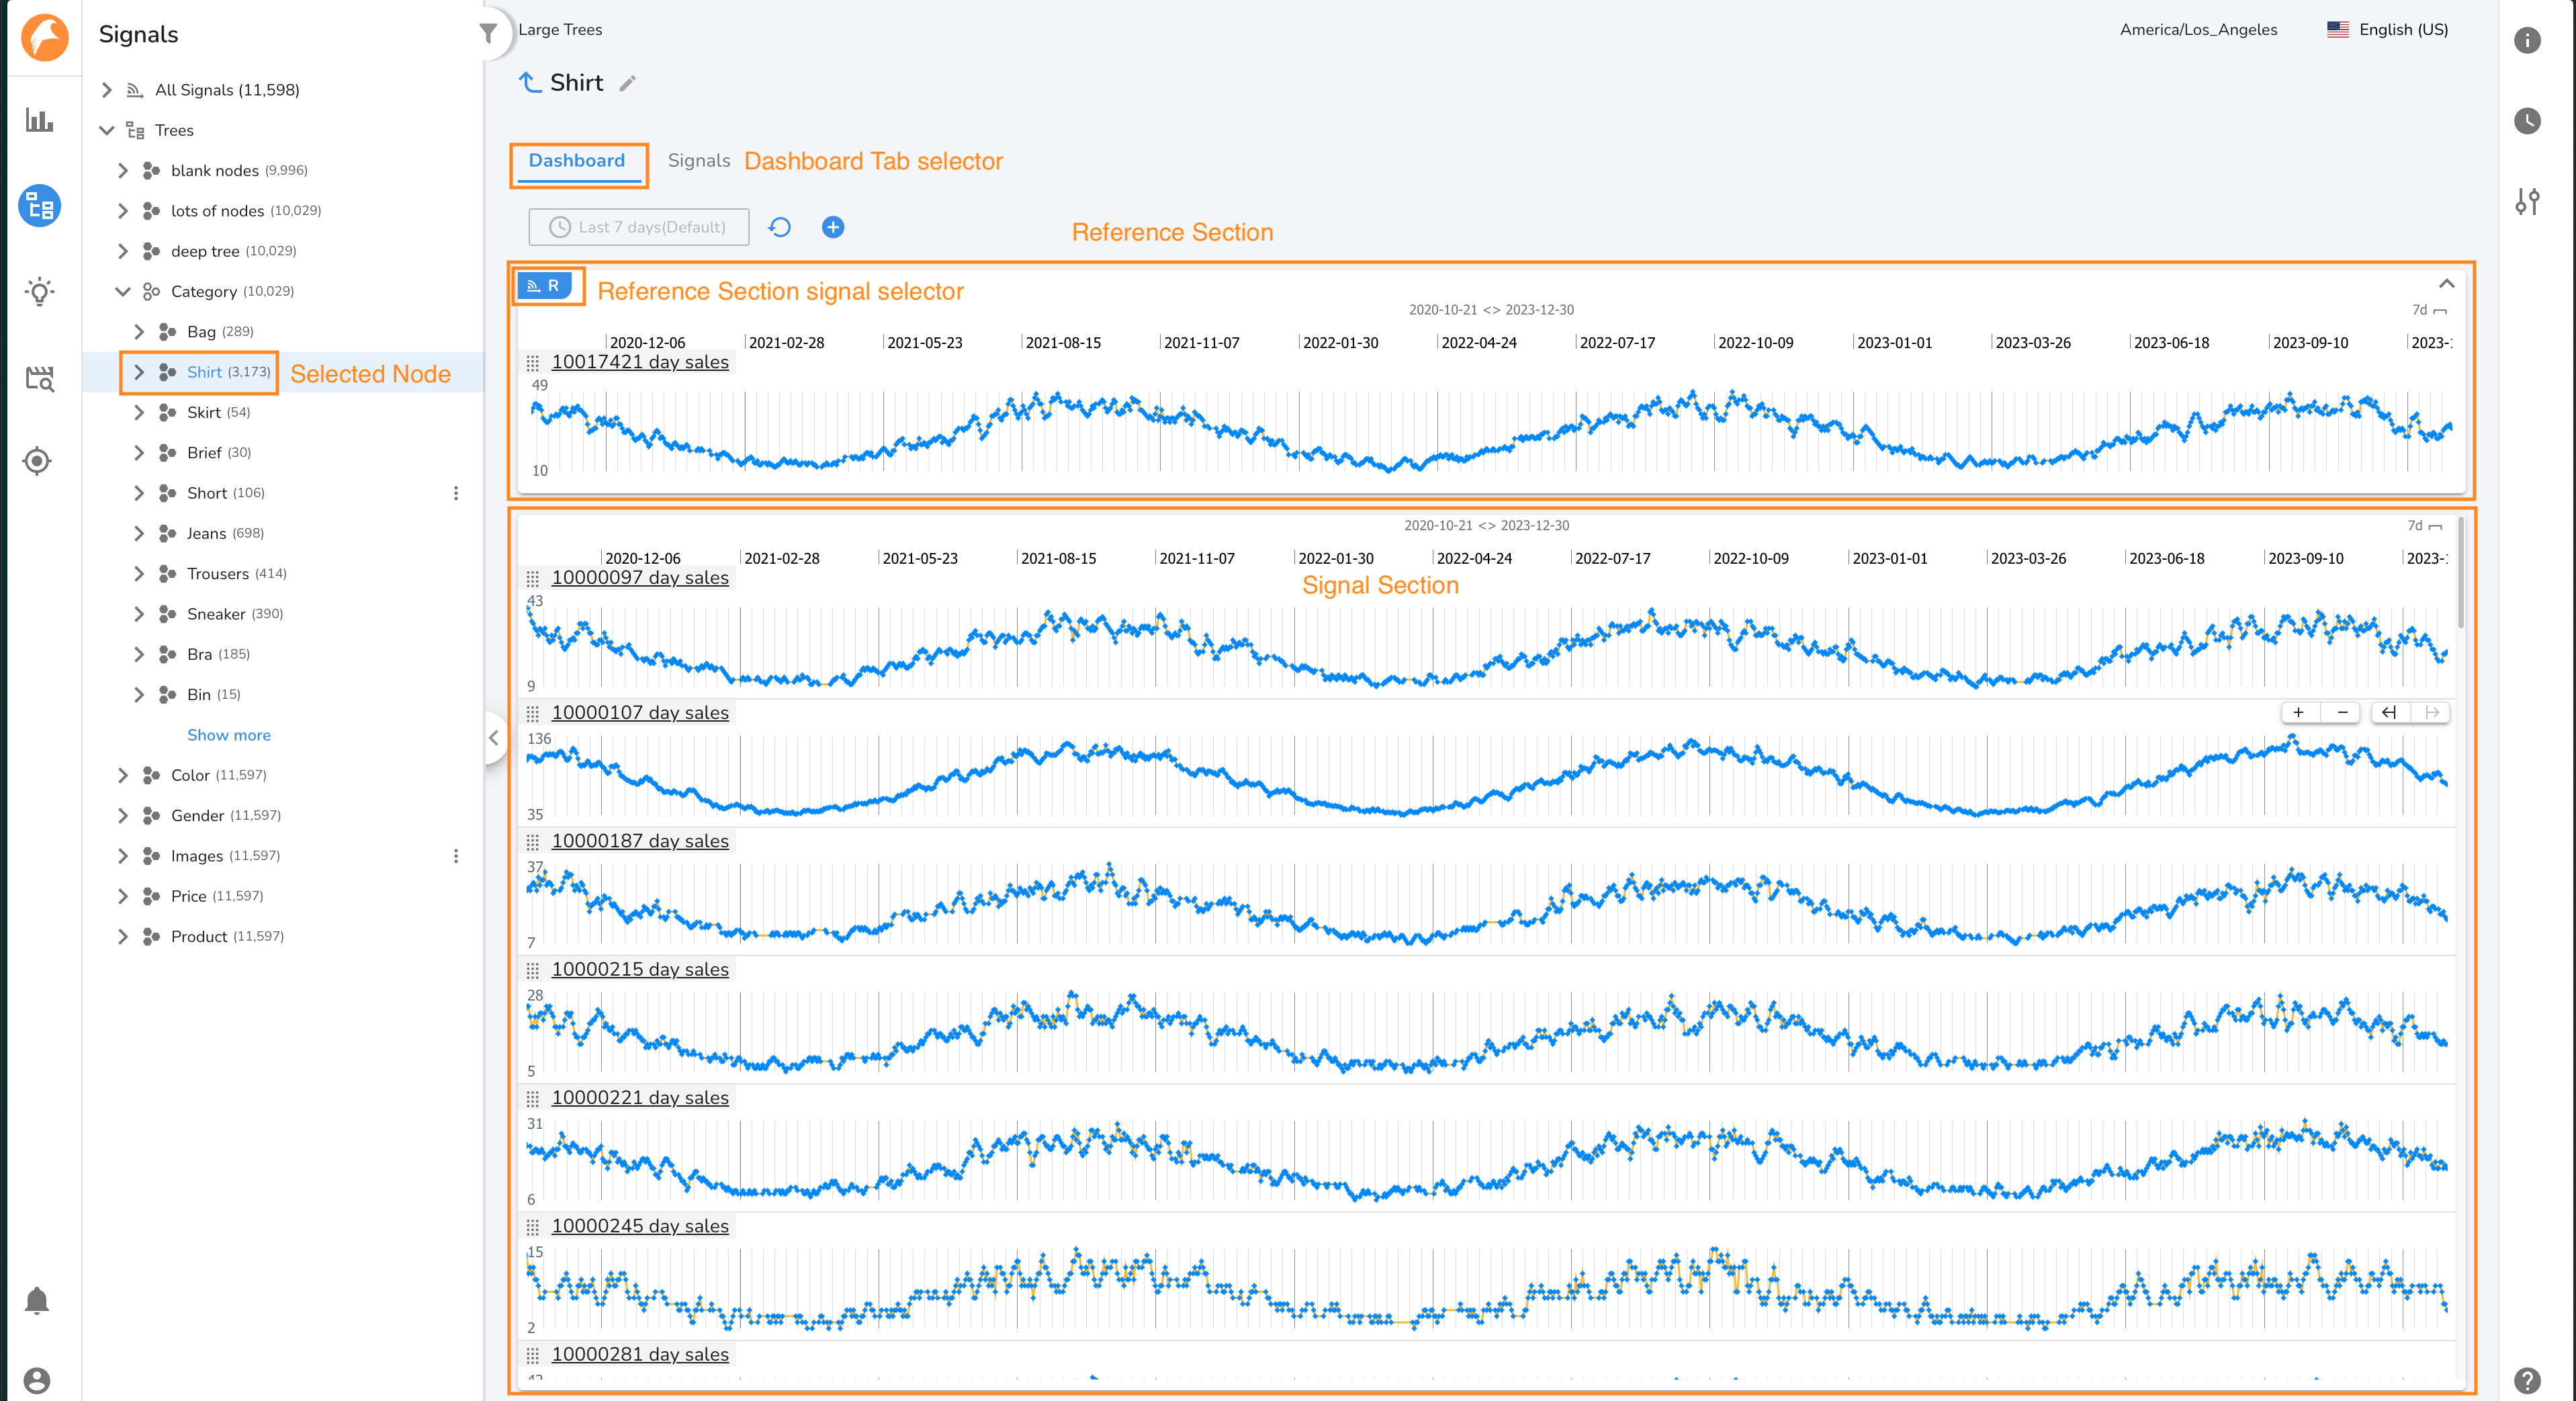
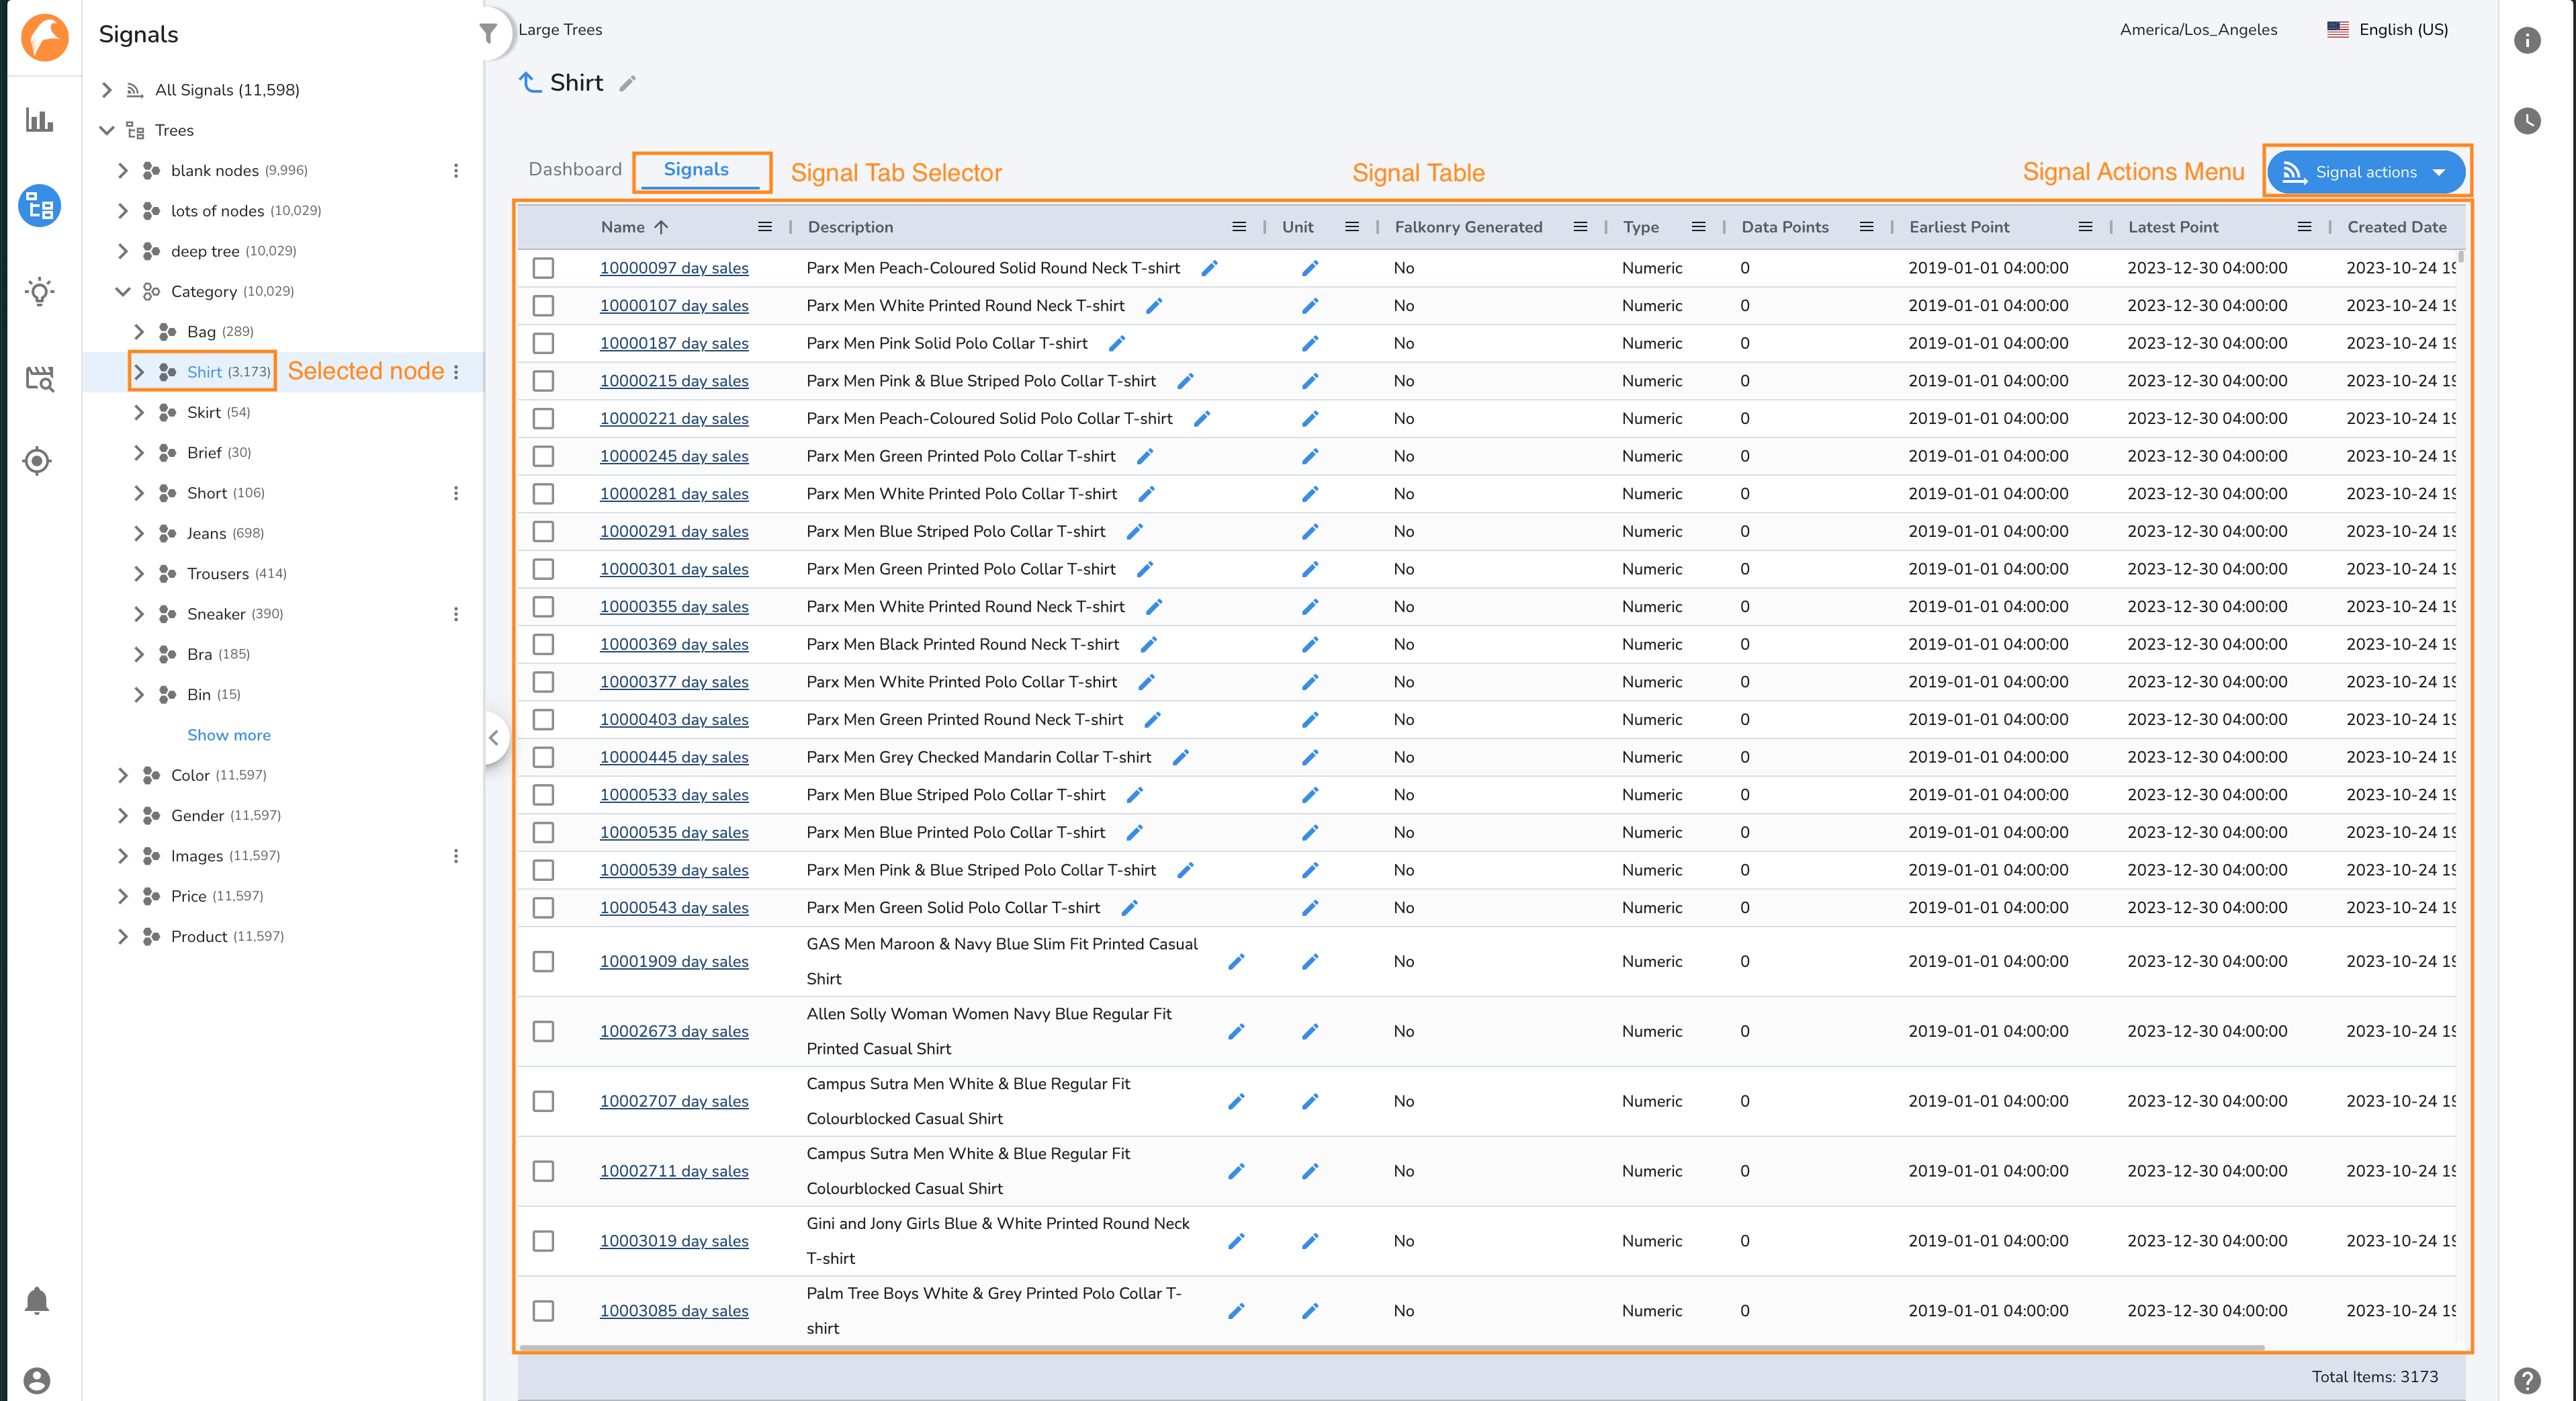
To view the signals associated with a node, click on a node in the Navigation Panel. The Node Page has two tabs to display signals associated with the node.
- Dashboard Tab The Dashboard Tab displays the signals associated with a node in timeline charts. It has two sections. The upper section, called the Reference Section, displays any signals from your account. To add or remove signals, click the R icon. The lower section, called the Signals Section, displays signals associated with the selected node. When Attribute Filters are applied, only signals which meet the filter criteria will be displayed in the Signals Section.
- Signals Tab The Signals Tab displays the signals associated with a node in a tabular view. In the table you can see metadata about your signals such as the number of datapoints loaded into Falkonry TSI, the earliest and latest point, and more.
Signal Attribute Filters
You may filter the Navigation Panel and Signals clicking the Attribute Filters button. This will open the Attribute Filter Panel, which enables you to filter by signal attributes. To apply one or more filters, click the Apply button.

When filters are applied, the Attribute Filter Icon will show as active. You will be navigated to the All Signals Node, which will display all signals which meet your filter criteria. The Navigation Panel will also update, displaying only trees and nodes which meet the applied filter criteria. The signal counts in the Navigation Panel will also update to reflect the number of signals associated with a node which meet the filter criteria.
To update the filter criteria, open the Attribute Filter Panel, update the filter criteria, and click apply. To clear the filter criteria, click the Clear All button.
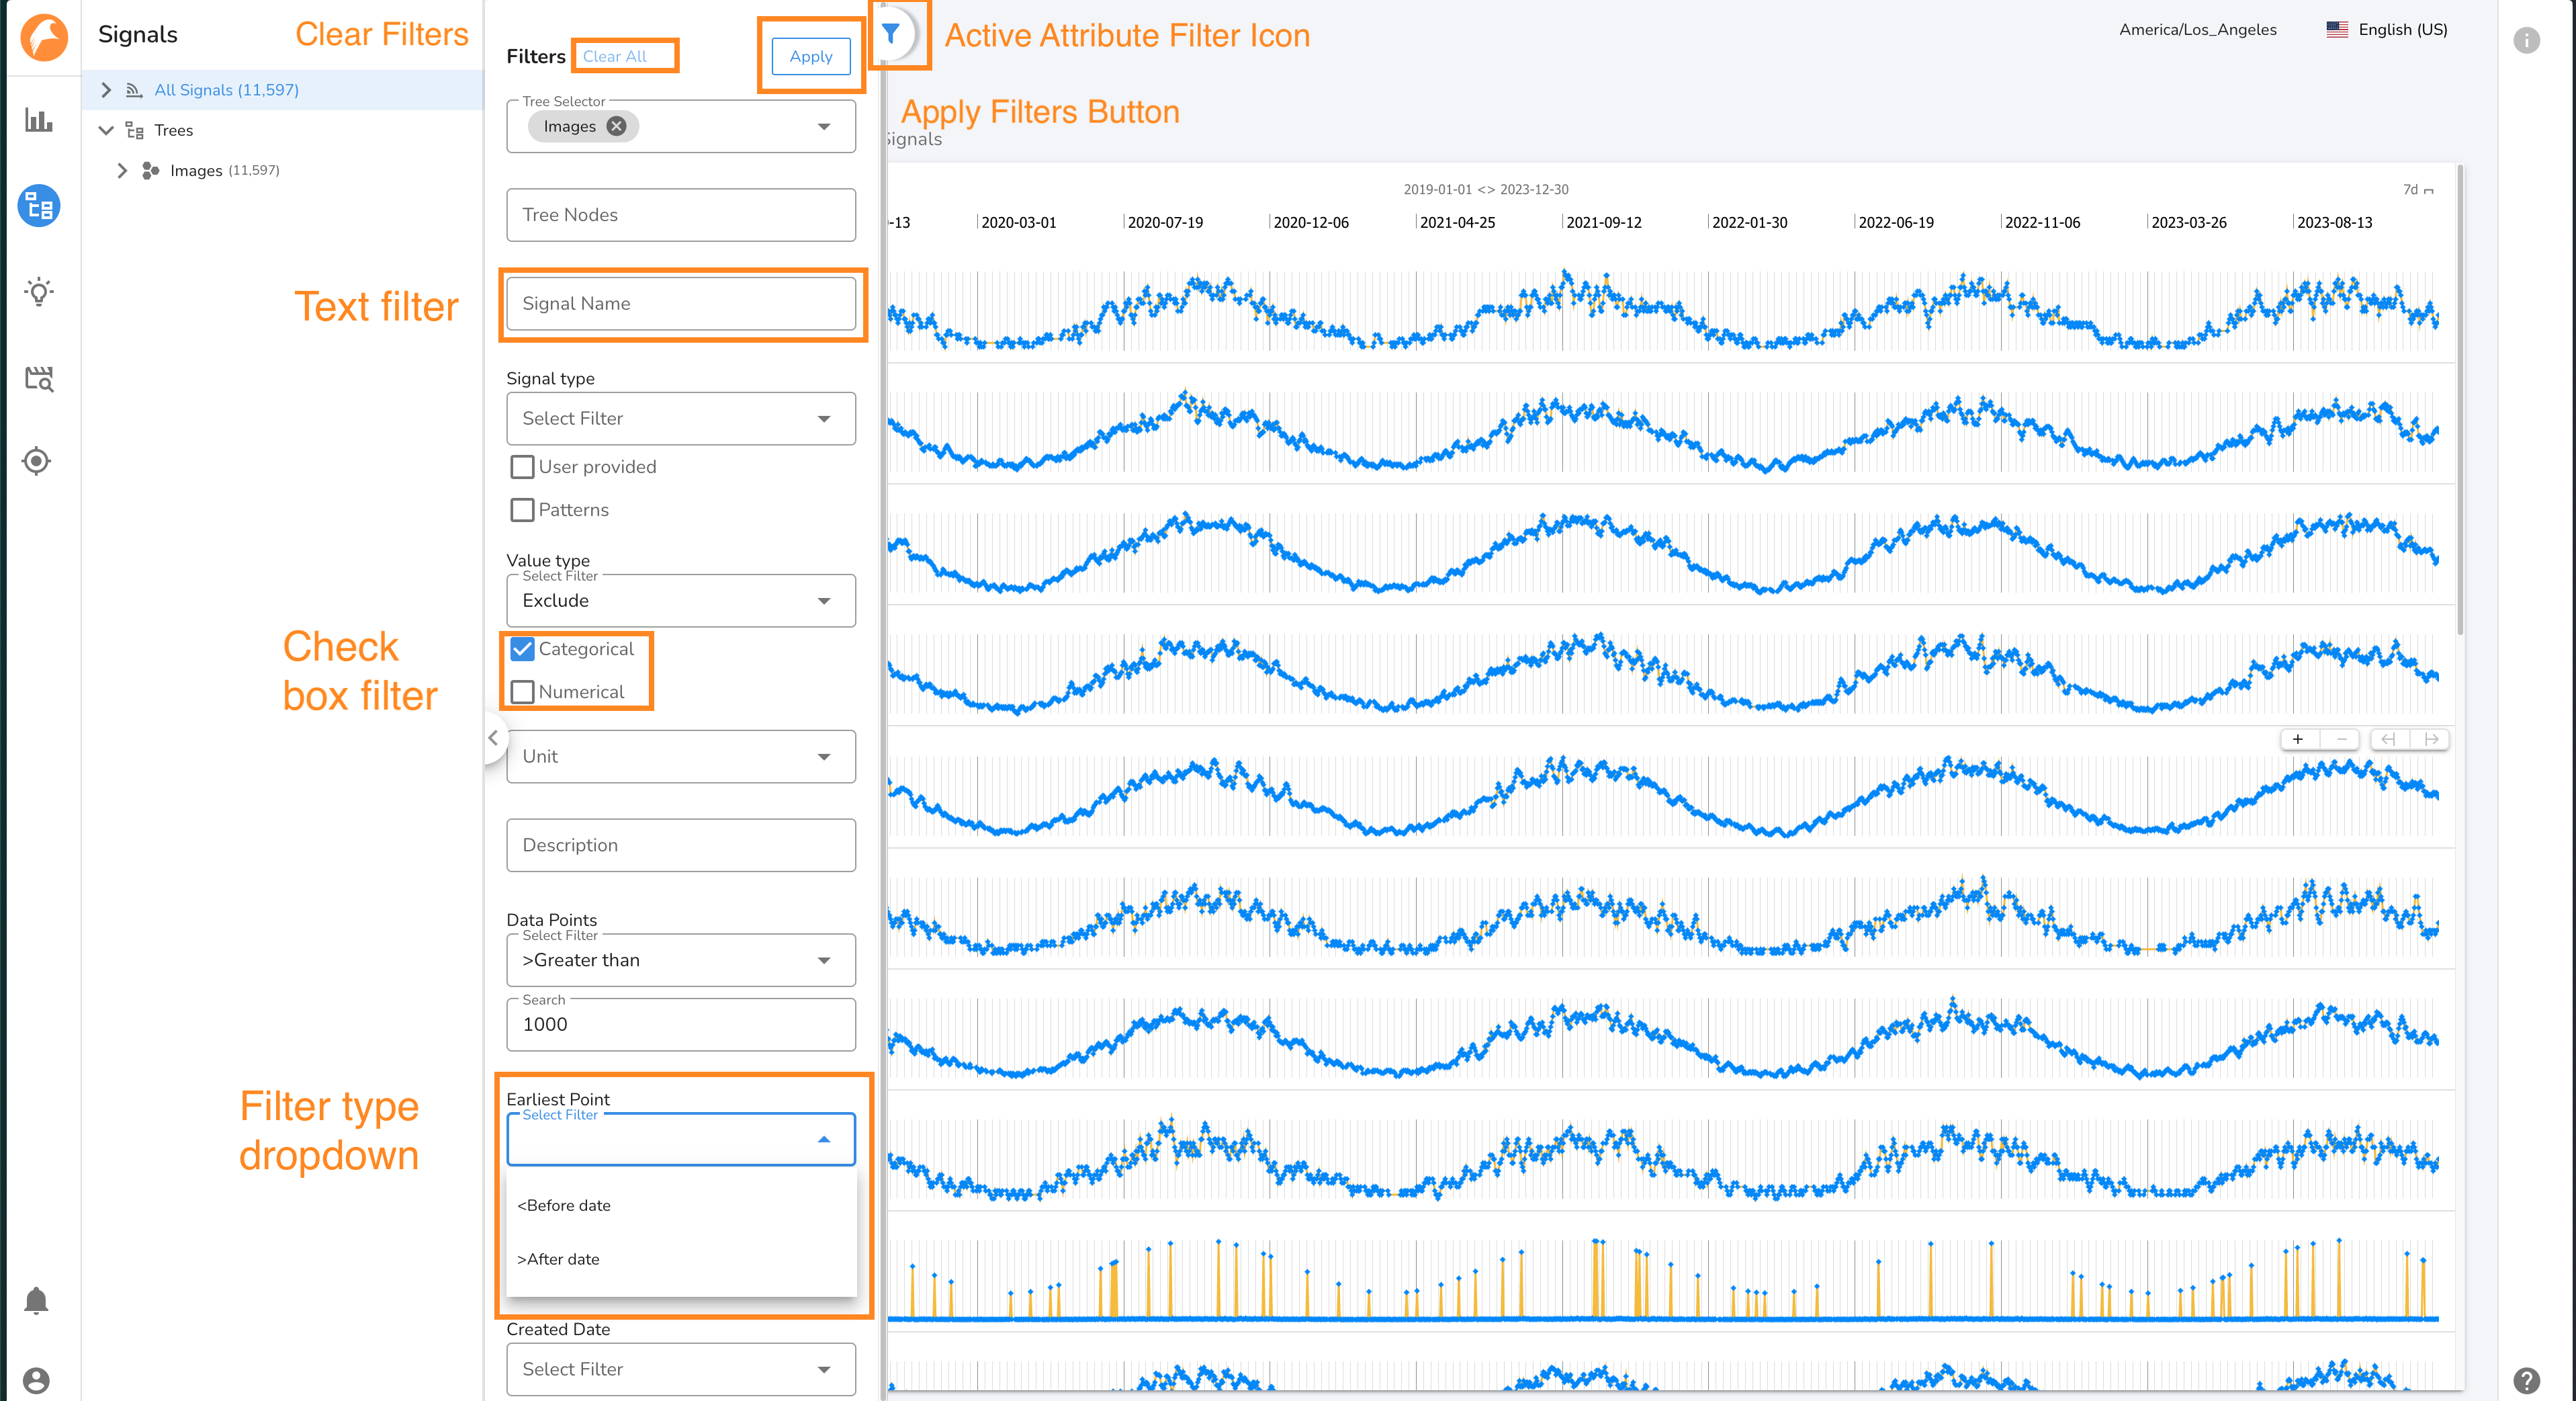
Filters
Within a filter criteria, multiple filter criteria will perform an \"OR\" operation. For example, in the Units attribute filter, selecting degrees and pressure will return signals with the units degrees OR signals with the units pressure. Across filter criteria, multiple filter criteria will perform an \"AND\" operation. For example, filtering the Value Type to \'categorical\' and the Node Name filter to \'Node 1\' will return categorical signals assigned to Node 1.
Some filters let you choose how to apply the filter. For example, for the Created Date filter, you may choose to filter to signals created Before or After the selected date.
Below is a list of the signals attributes which may be filtered.
- Tree Name Filters Trees by their names. Regex enabled.
- Node Name Filters Tree Nodes by their name. Regex enabled.
- Signal Name Filters signals by their name. Regex enabled.
- Signal Source Filters signals by the source of the signal.
- User Provided signals are those sent to TSI from the your system.
- Patterns signals are the outputs of Falonkry Patterns models.
- To filter to signals which are the outputs of Insights, set the filter type to Exclude, and check both User Provided and Patterns options.
- Value Type Filters the signals based on the type of data the signal contains.
- Unit Filters signals by the Units property, which can be set upon ingestion, or on the Signals tab on the All Signals Page.
- Descrition Filters signals by their description, which can be edited on the Signals Tab of the All Signals Page.
- Data Points Filters signals by the total number of data points associated with a signal in Falkonry TSI. The filter may be set to \"greater than\" or \"less than\" a value.
- Earliest Point Filters signals by the the date of the earliest data point associated with a signal. The filter may be set to \"before\" or \"after\" a date.
- Latest Point Filters signals by the the date of the latest data point associated with a signal. The filter may be set to \"before\" or \"after\" a date.
- Created Date Filters signals by the the date the signal was approved in Falkonry TSI. The filter may be set to \"before\" or \"after\" a date.
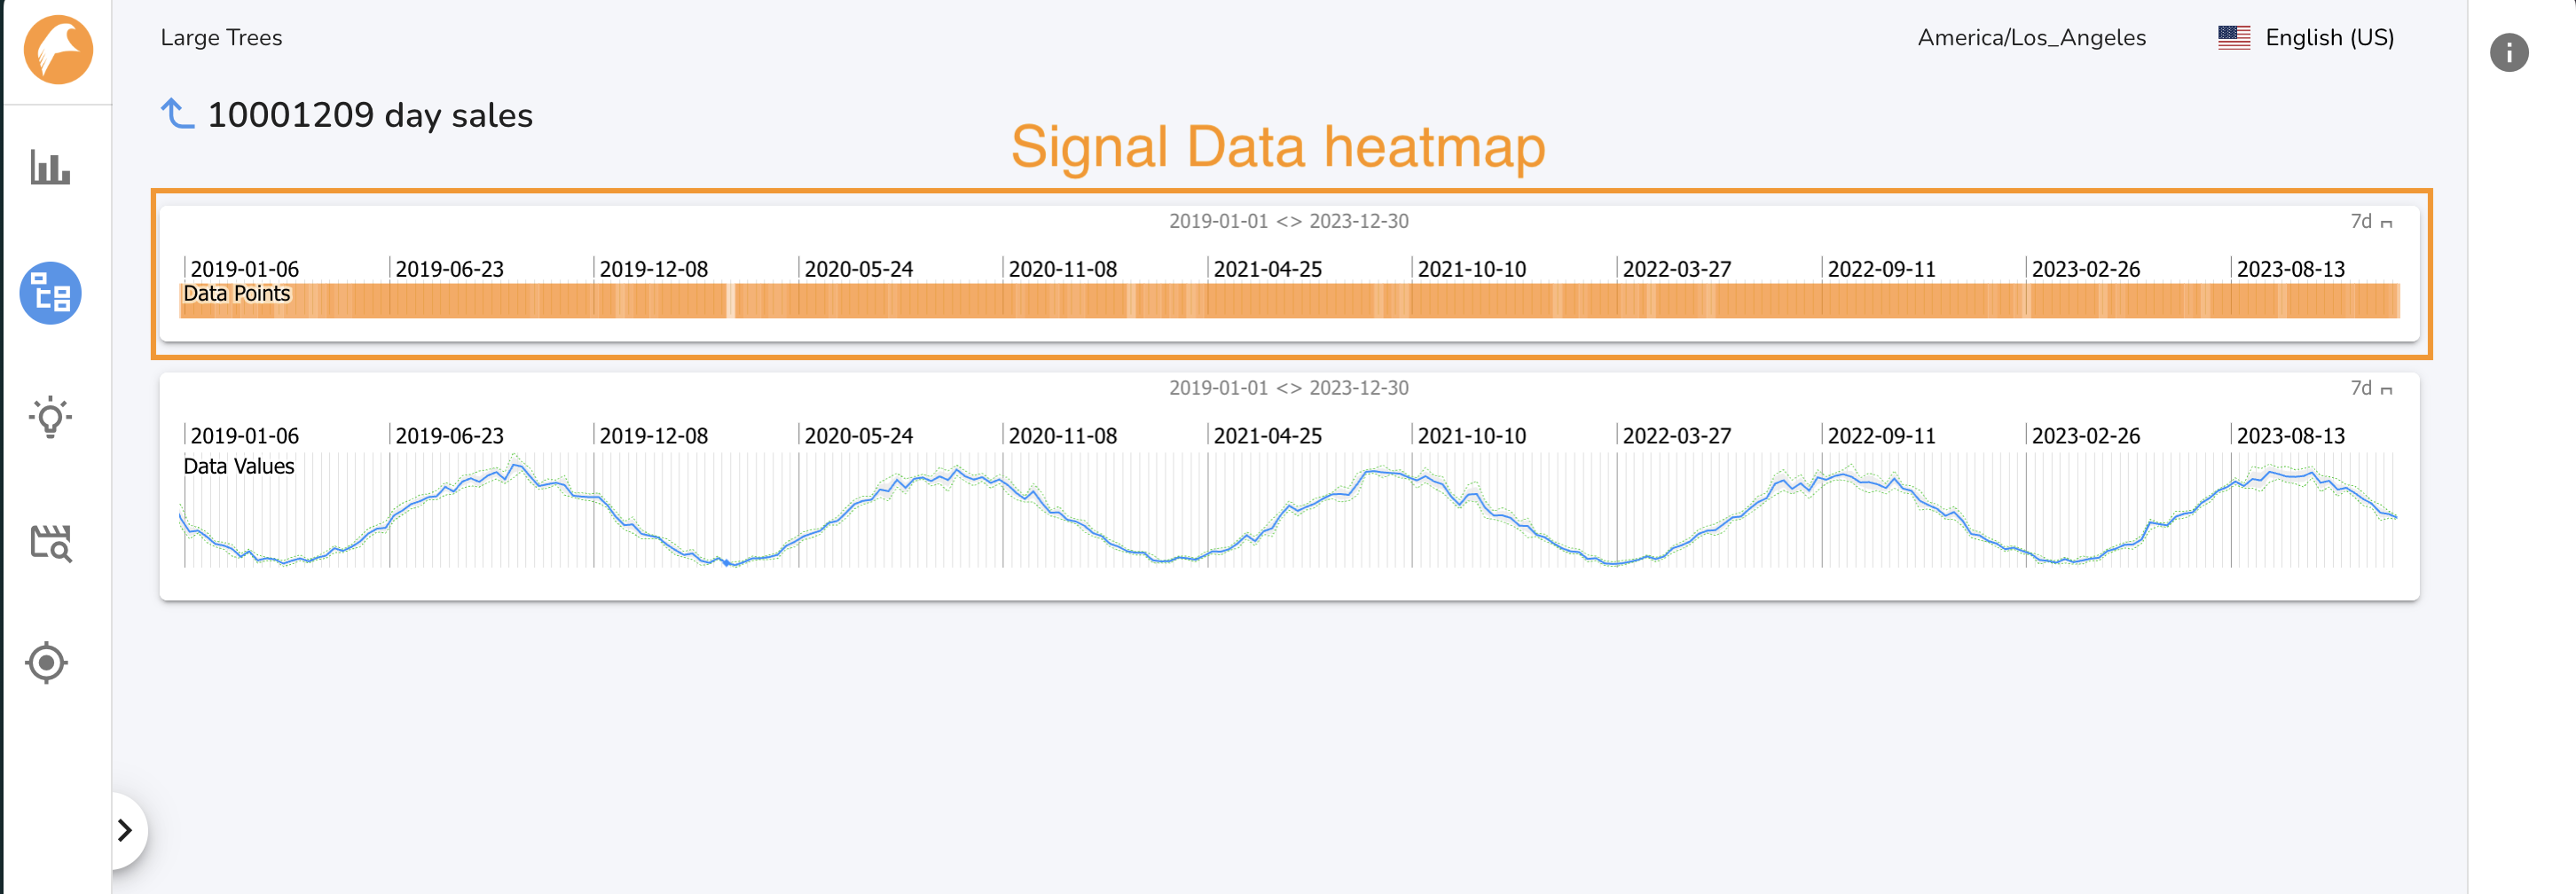
Single Signal page
The Single Signal Page shows a signal and visualizes the data density for that signal. This is a quick way to determine if Falkonry TSI has been consistently recieveing data for a given signal. To access the Single Signal page for a given signal, click on the signal\'s name on the Signals Tab of the All Signals page or a Tree Node page. Click the back arrow to return to the ALl Signals page. When you navigate to a Single Signal page, a node is displayed in the Navigation Panel under the All Signals node. Up to 10 Single Signal nodes will be displayed.