Signal Value Distributions (SVD) Widget
The Signal Value Distribution, or SVD, widget is a powerful way to view the distribution of values a signal takes on over a given time range. It is useful for comparing behavior across signals and time periods.
Creating a Signal Value Distribution widget
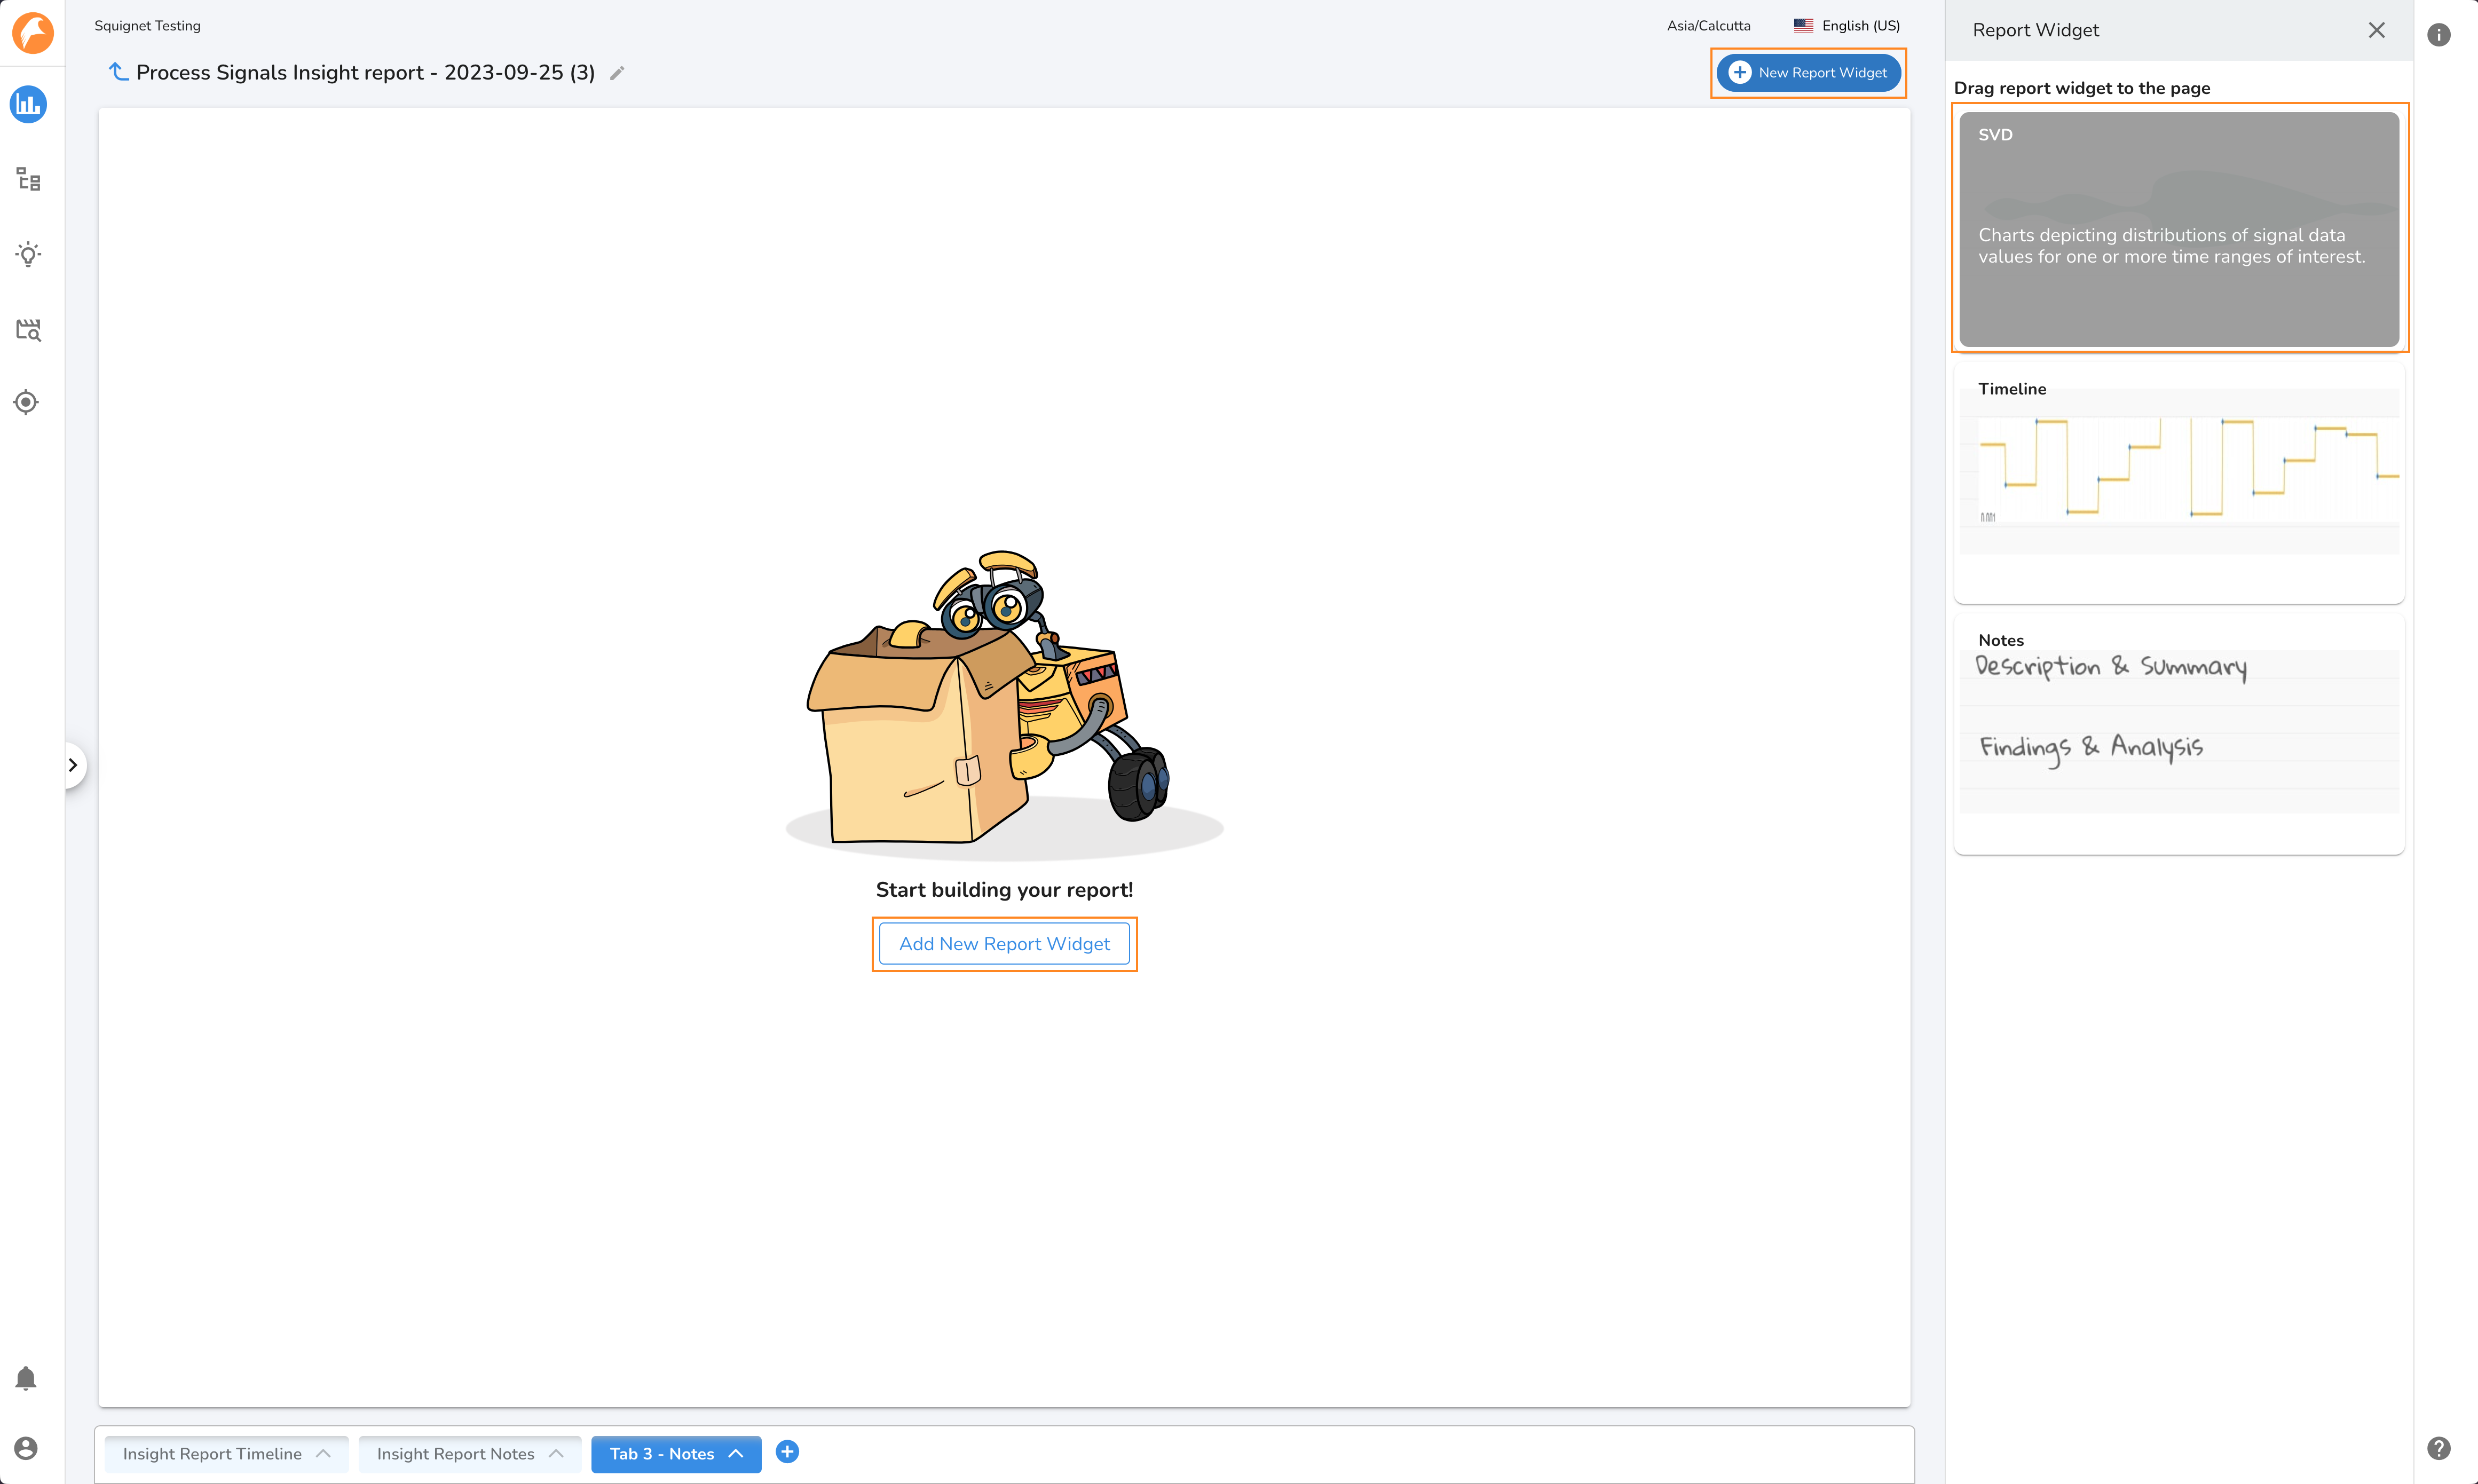
To create an SVD widget, click the New Report Widget button and drag an SVD widget onto the desired position on the tab.
Choosing the SVD type
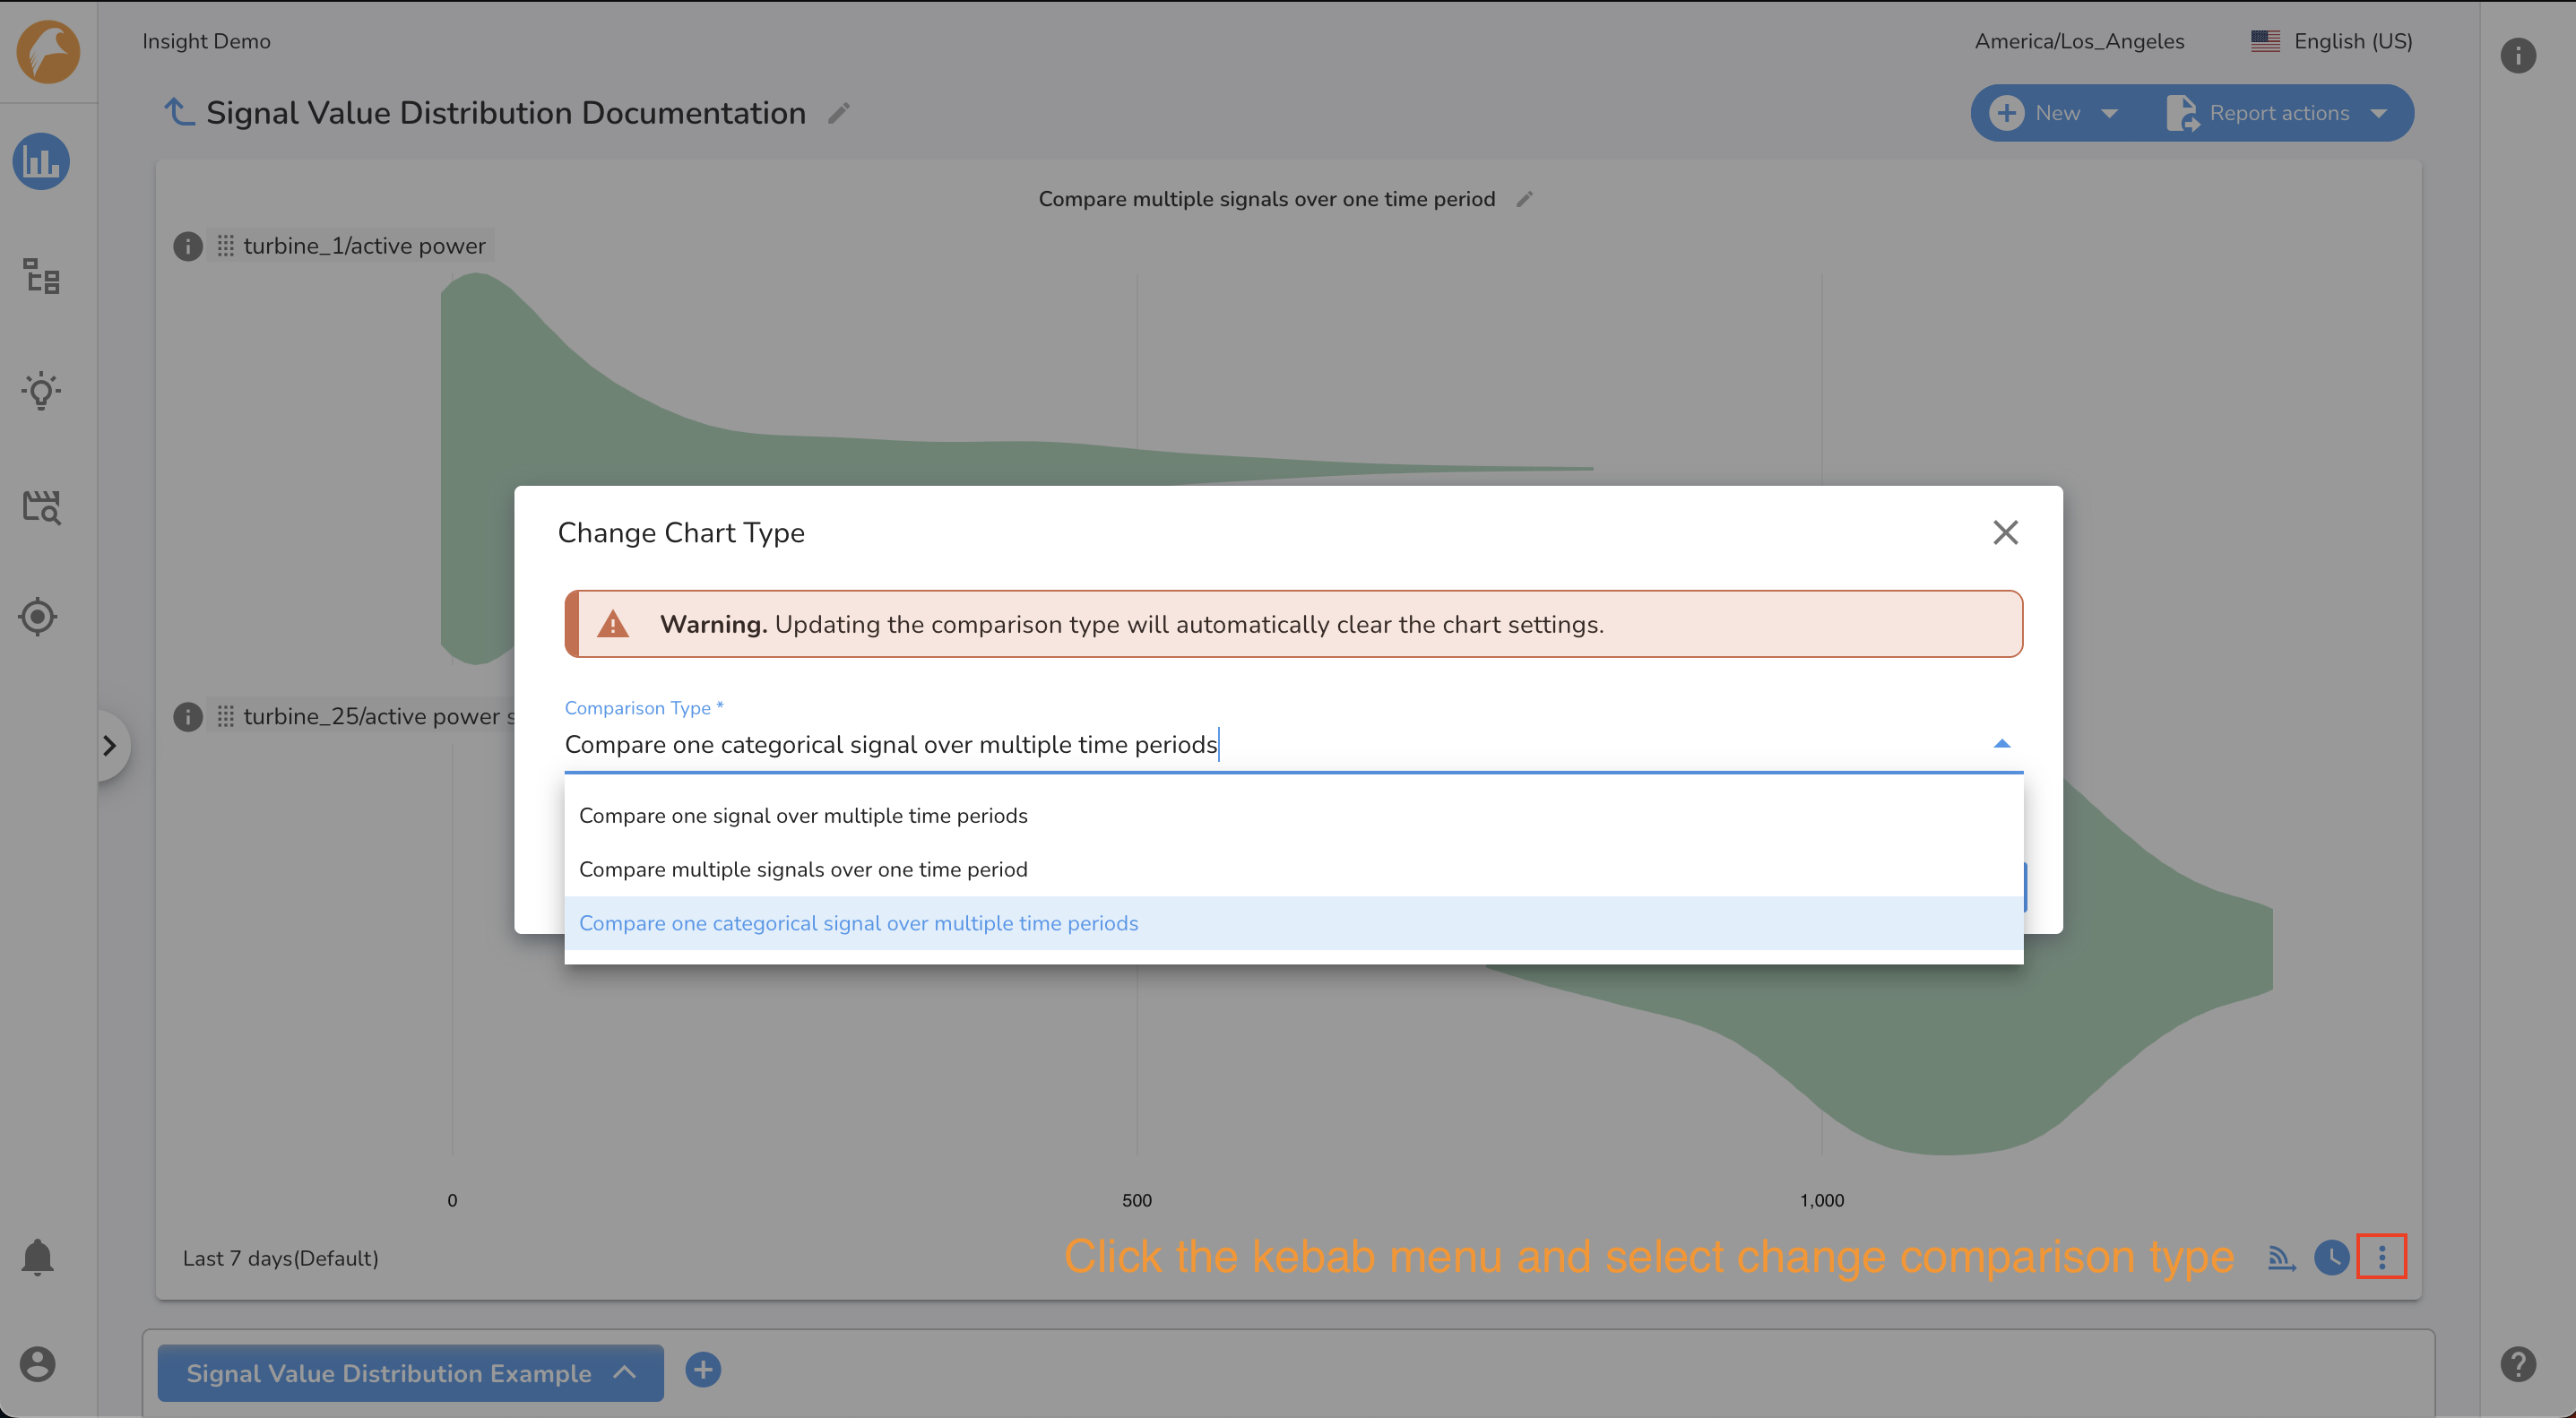
SVDs enable three different kinds of comparisons. To change the comparison type, click the Kebab Menu and choose the Change comparison type option. Note that changing the comparison type of an SVD will clear the chart settings, including selected signals and time ranges.
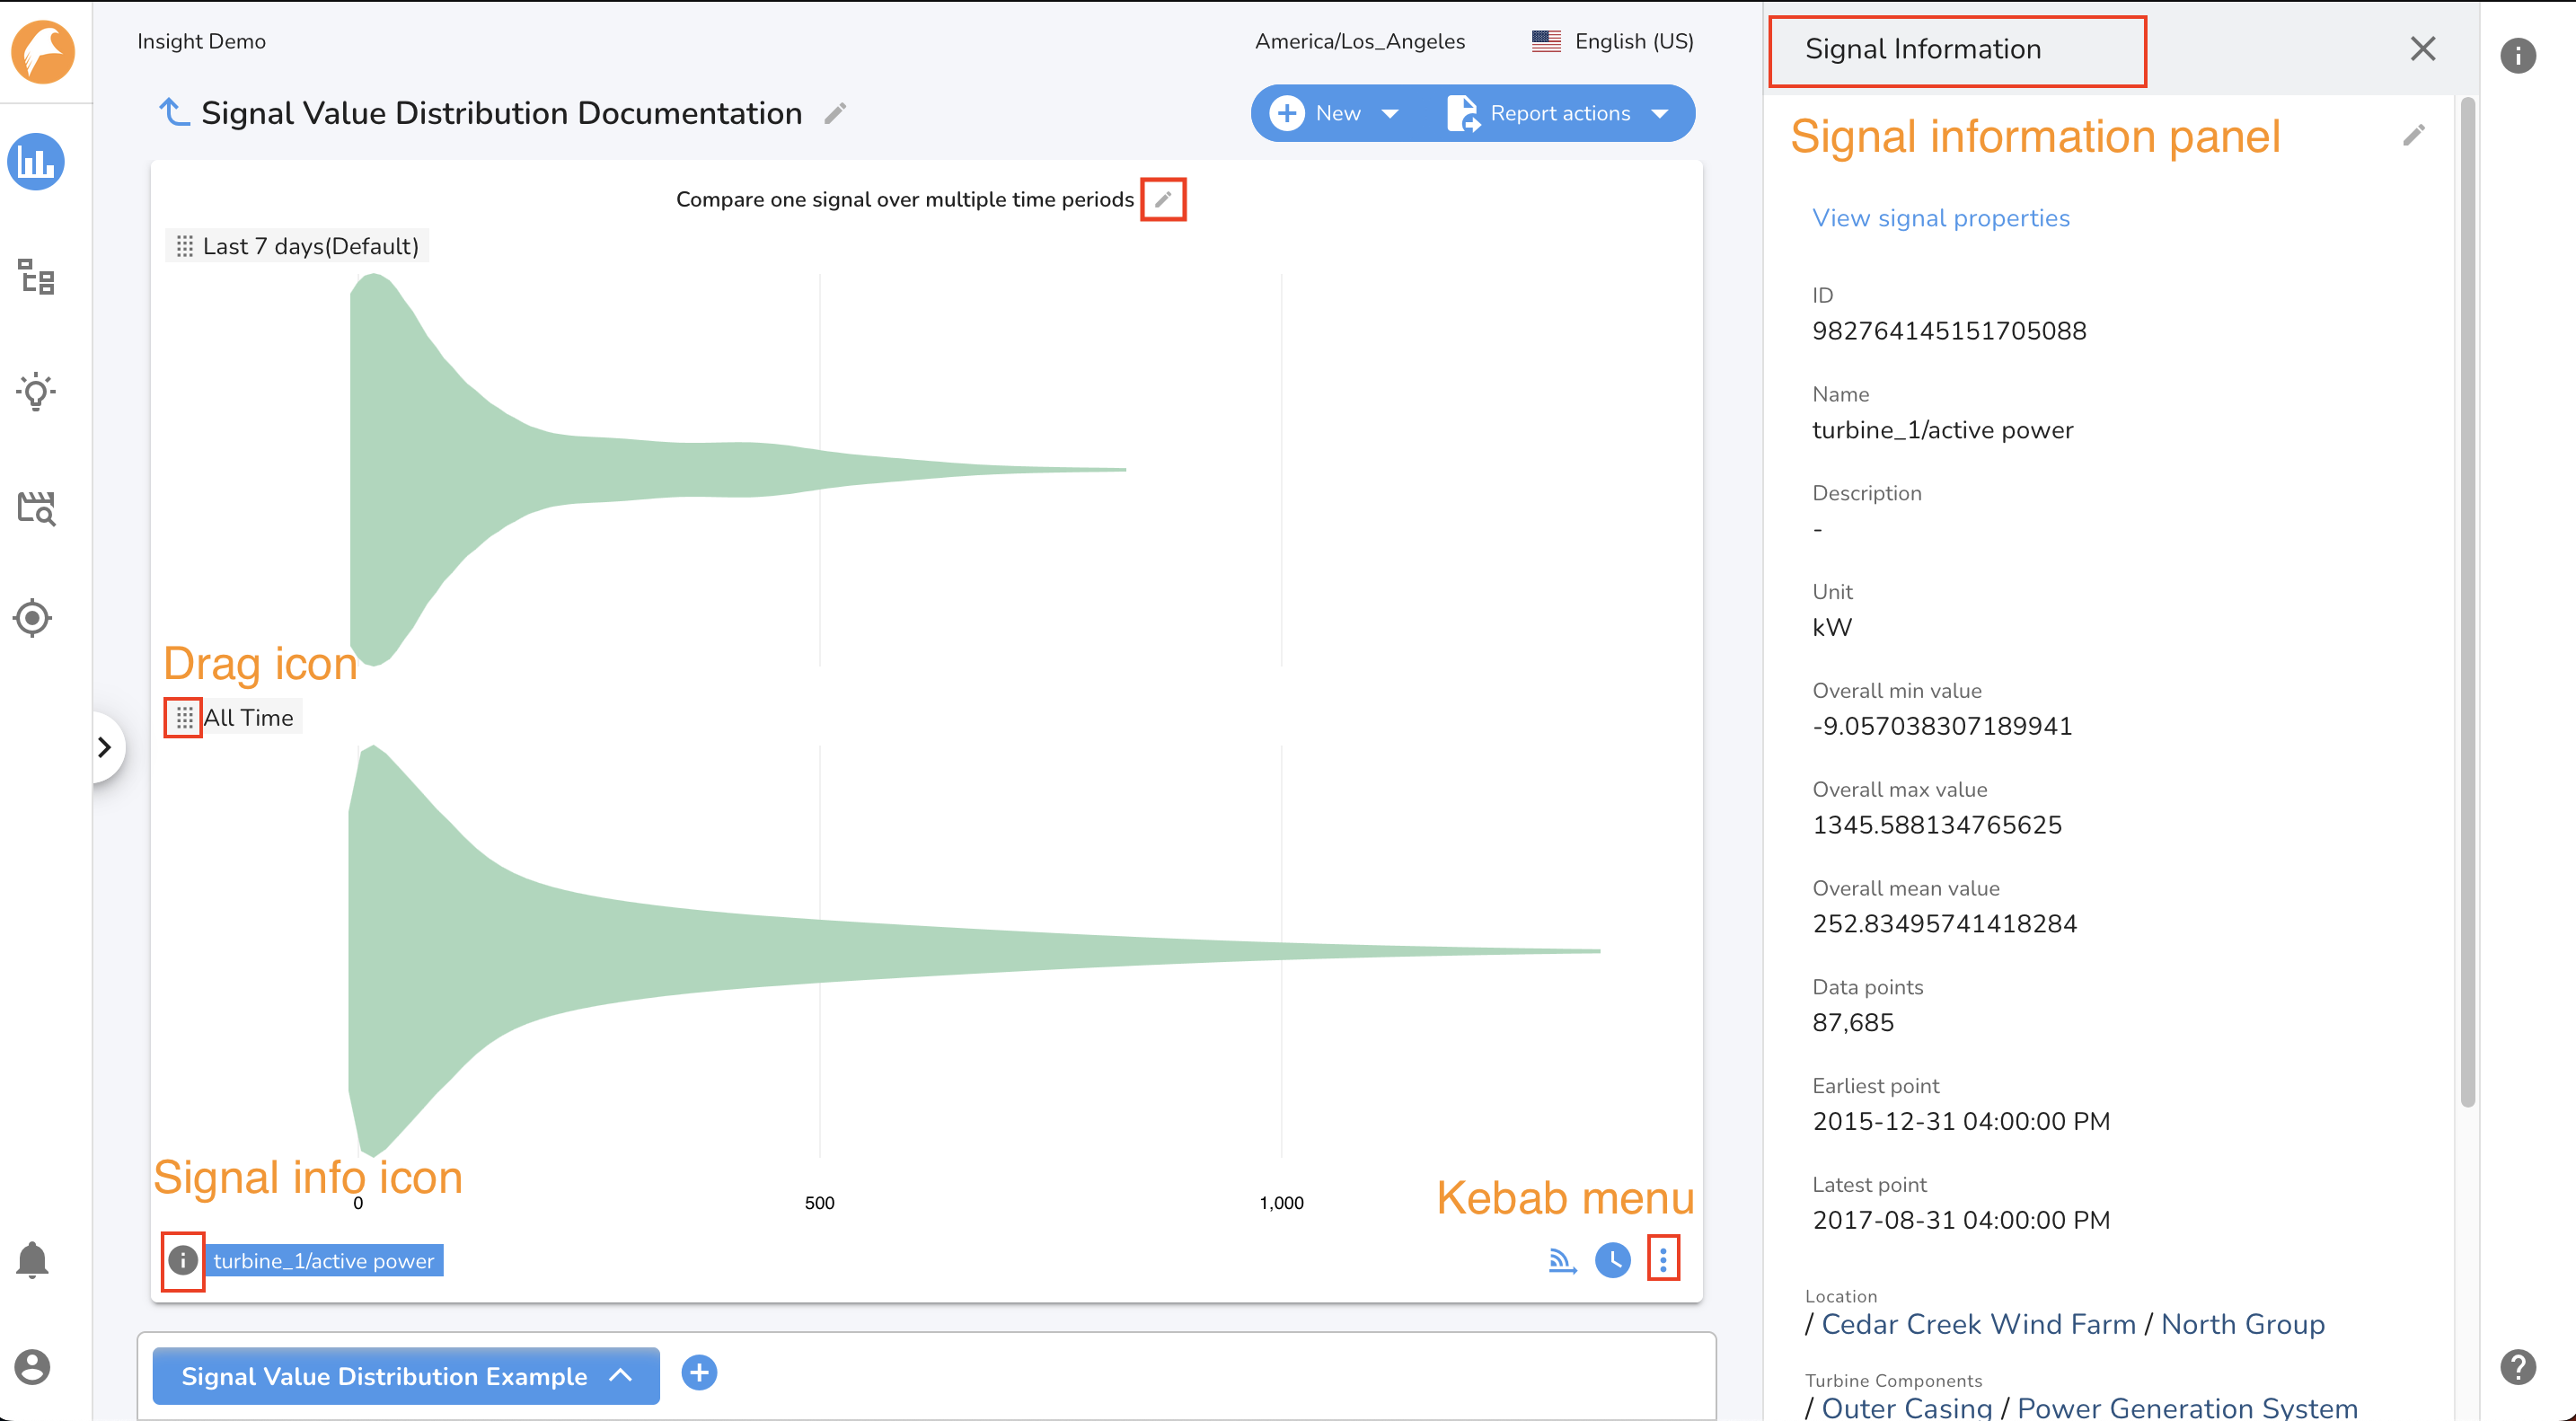
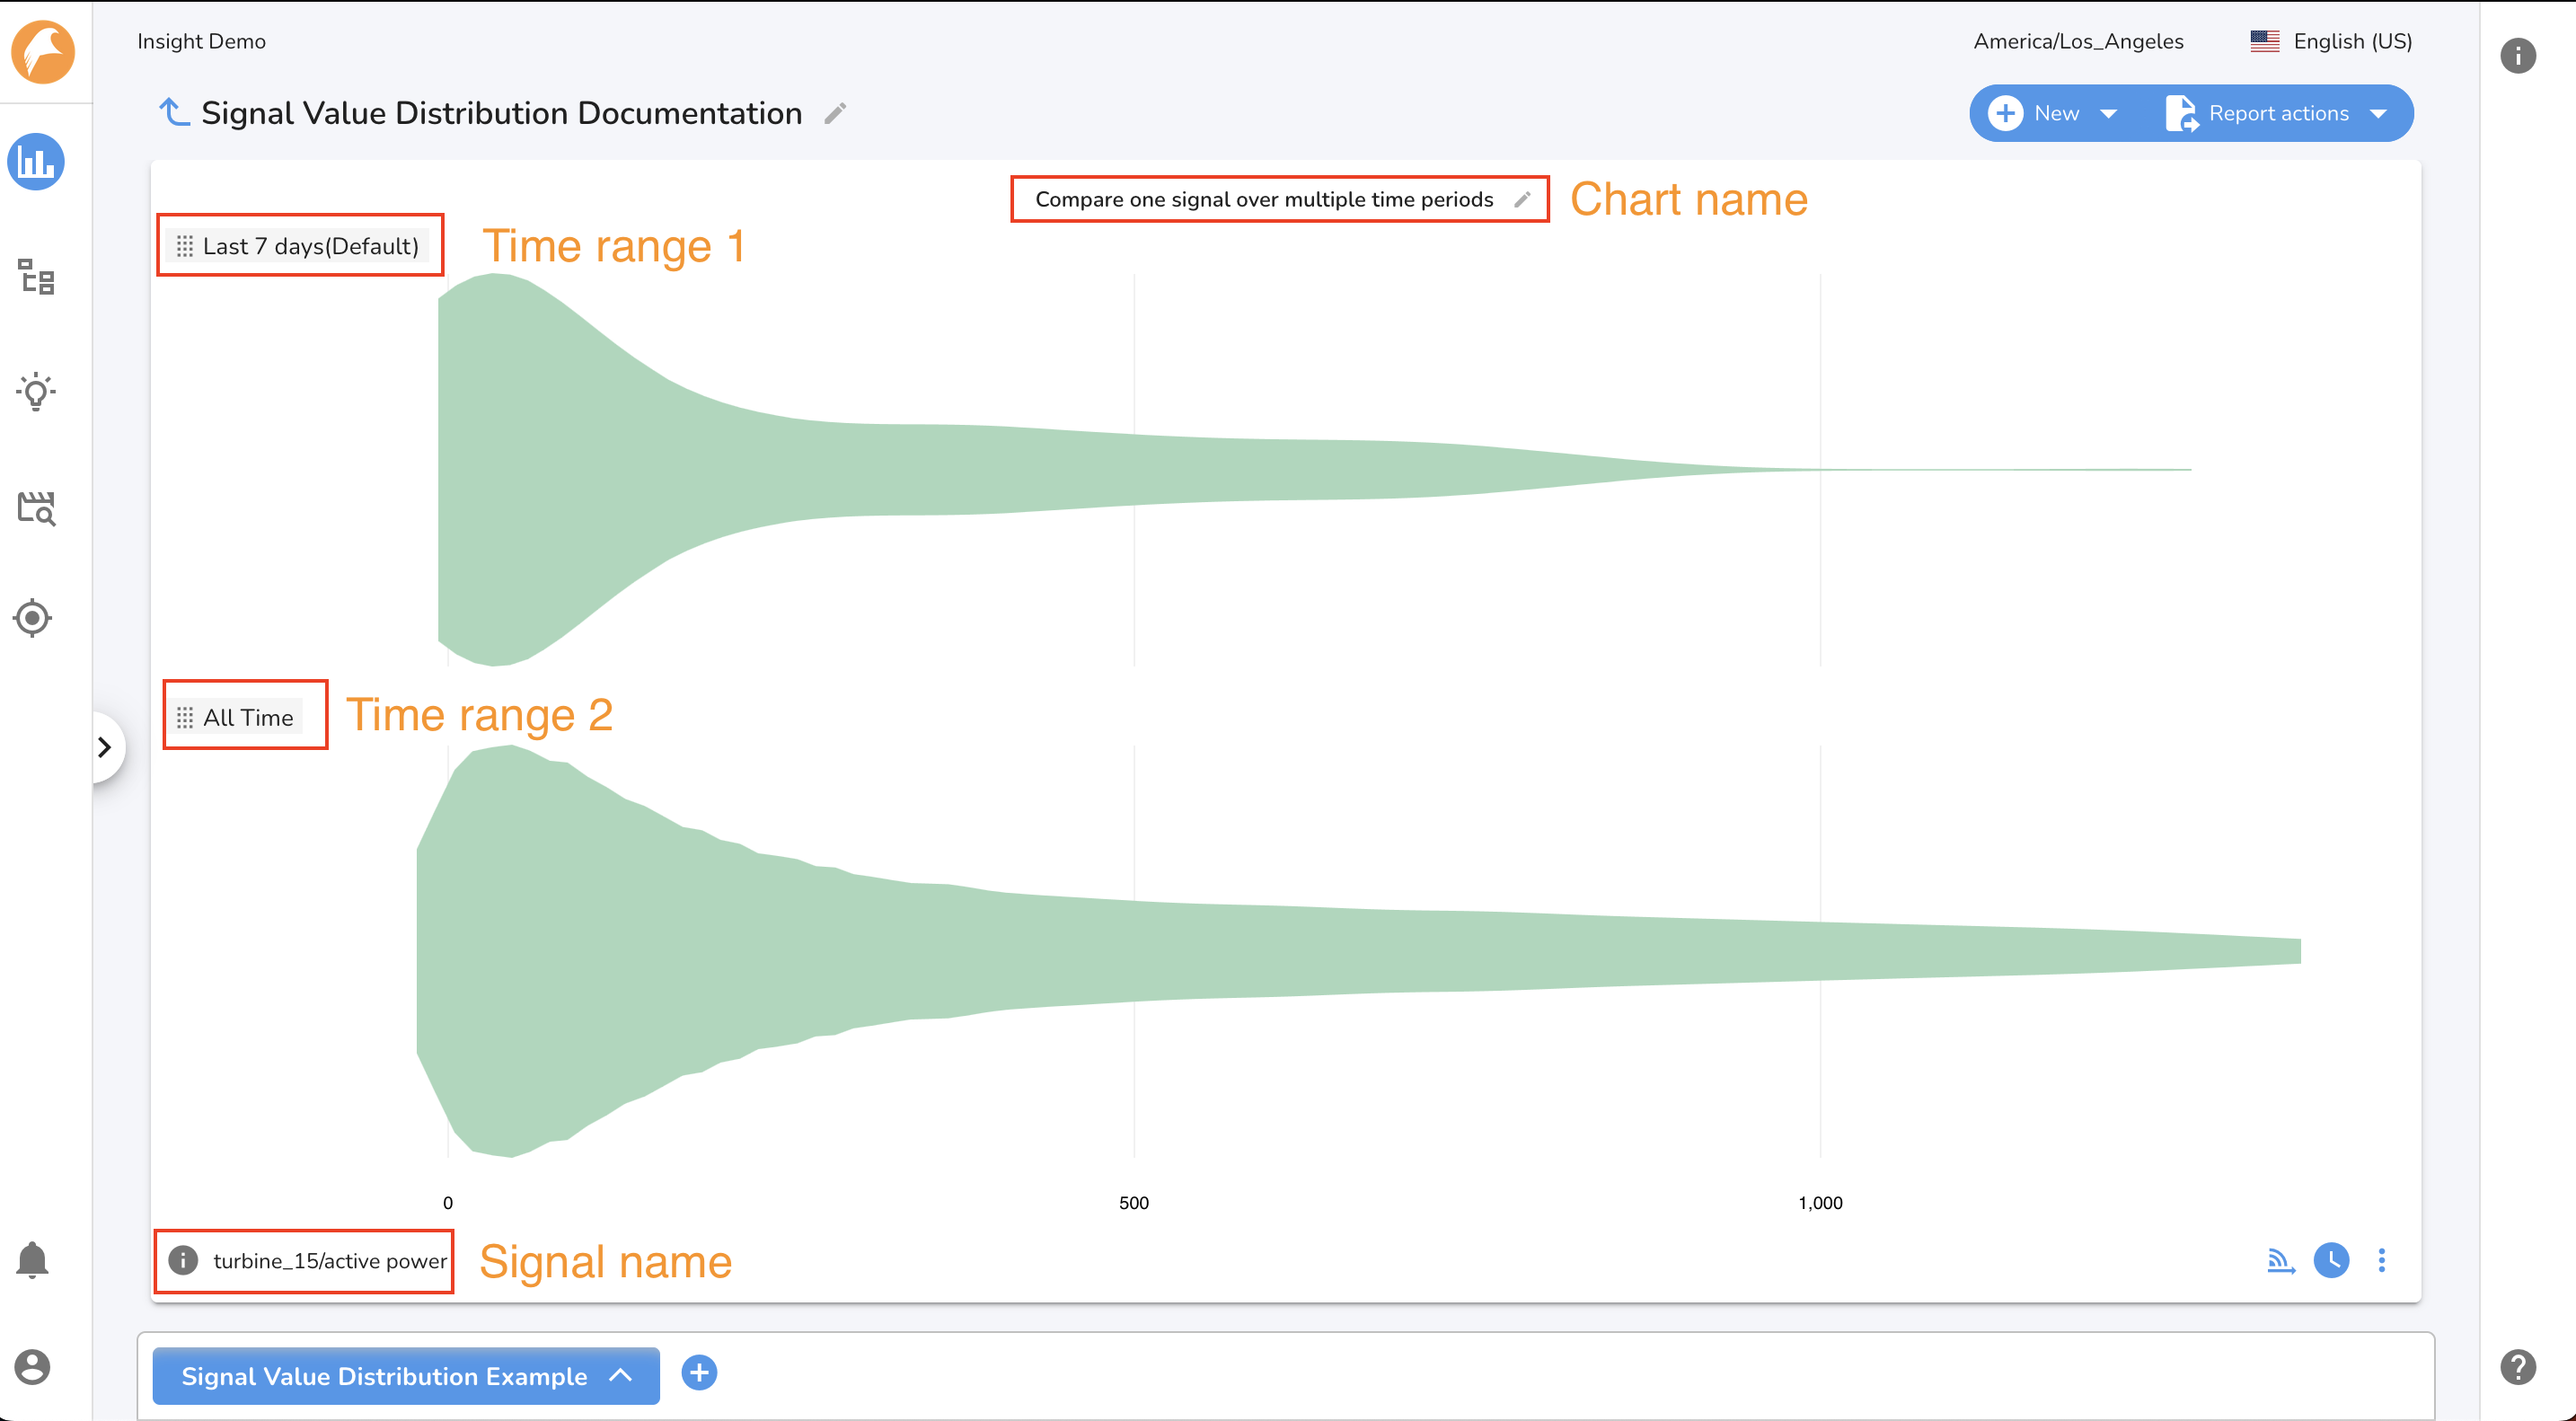
Compare one signal over multiple time ranges
This SVD chart type enables you to add a single signal to the chart, and add 1 or more time ranges to the chart. This chart type is best used when you care about a specific signal\'s distribution across different time range contexts.
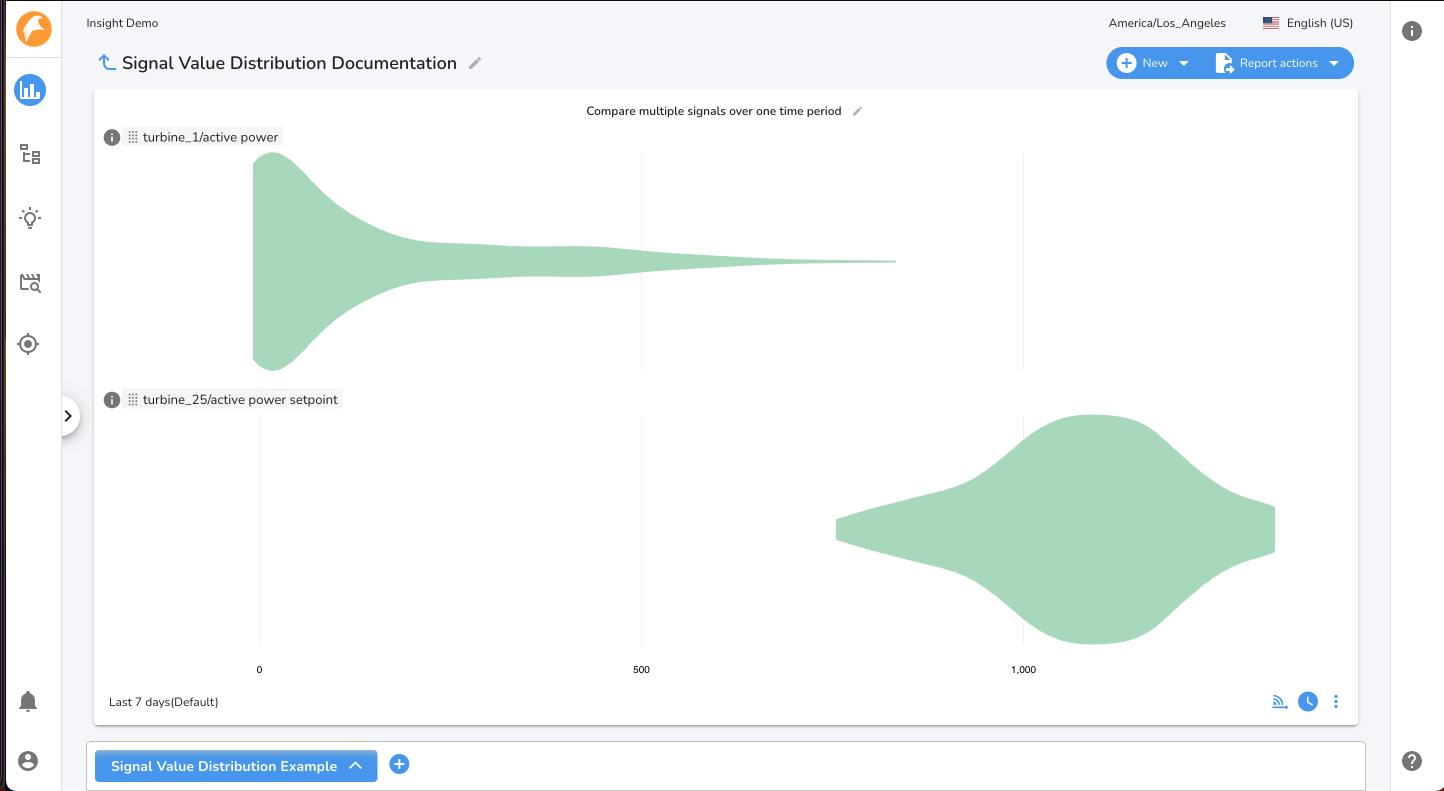
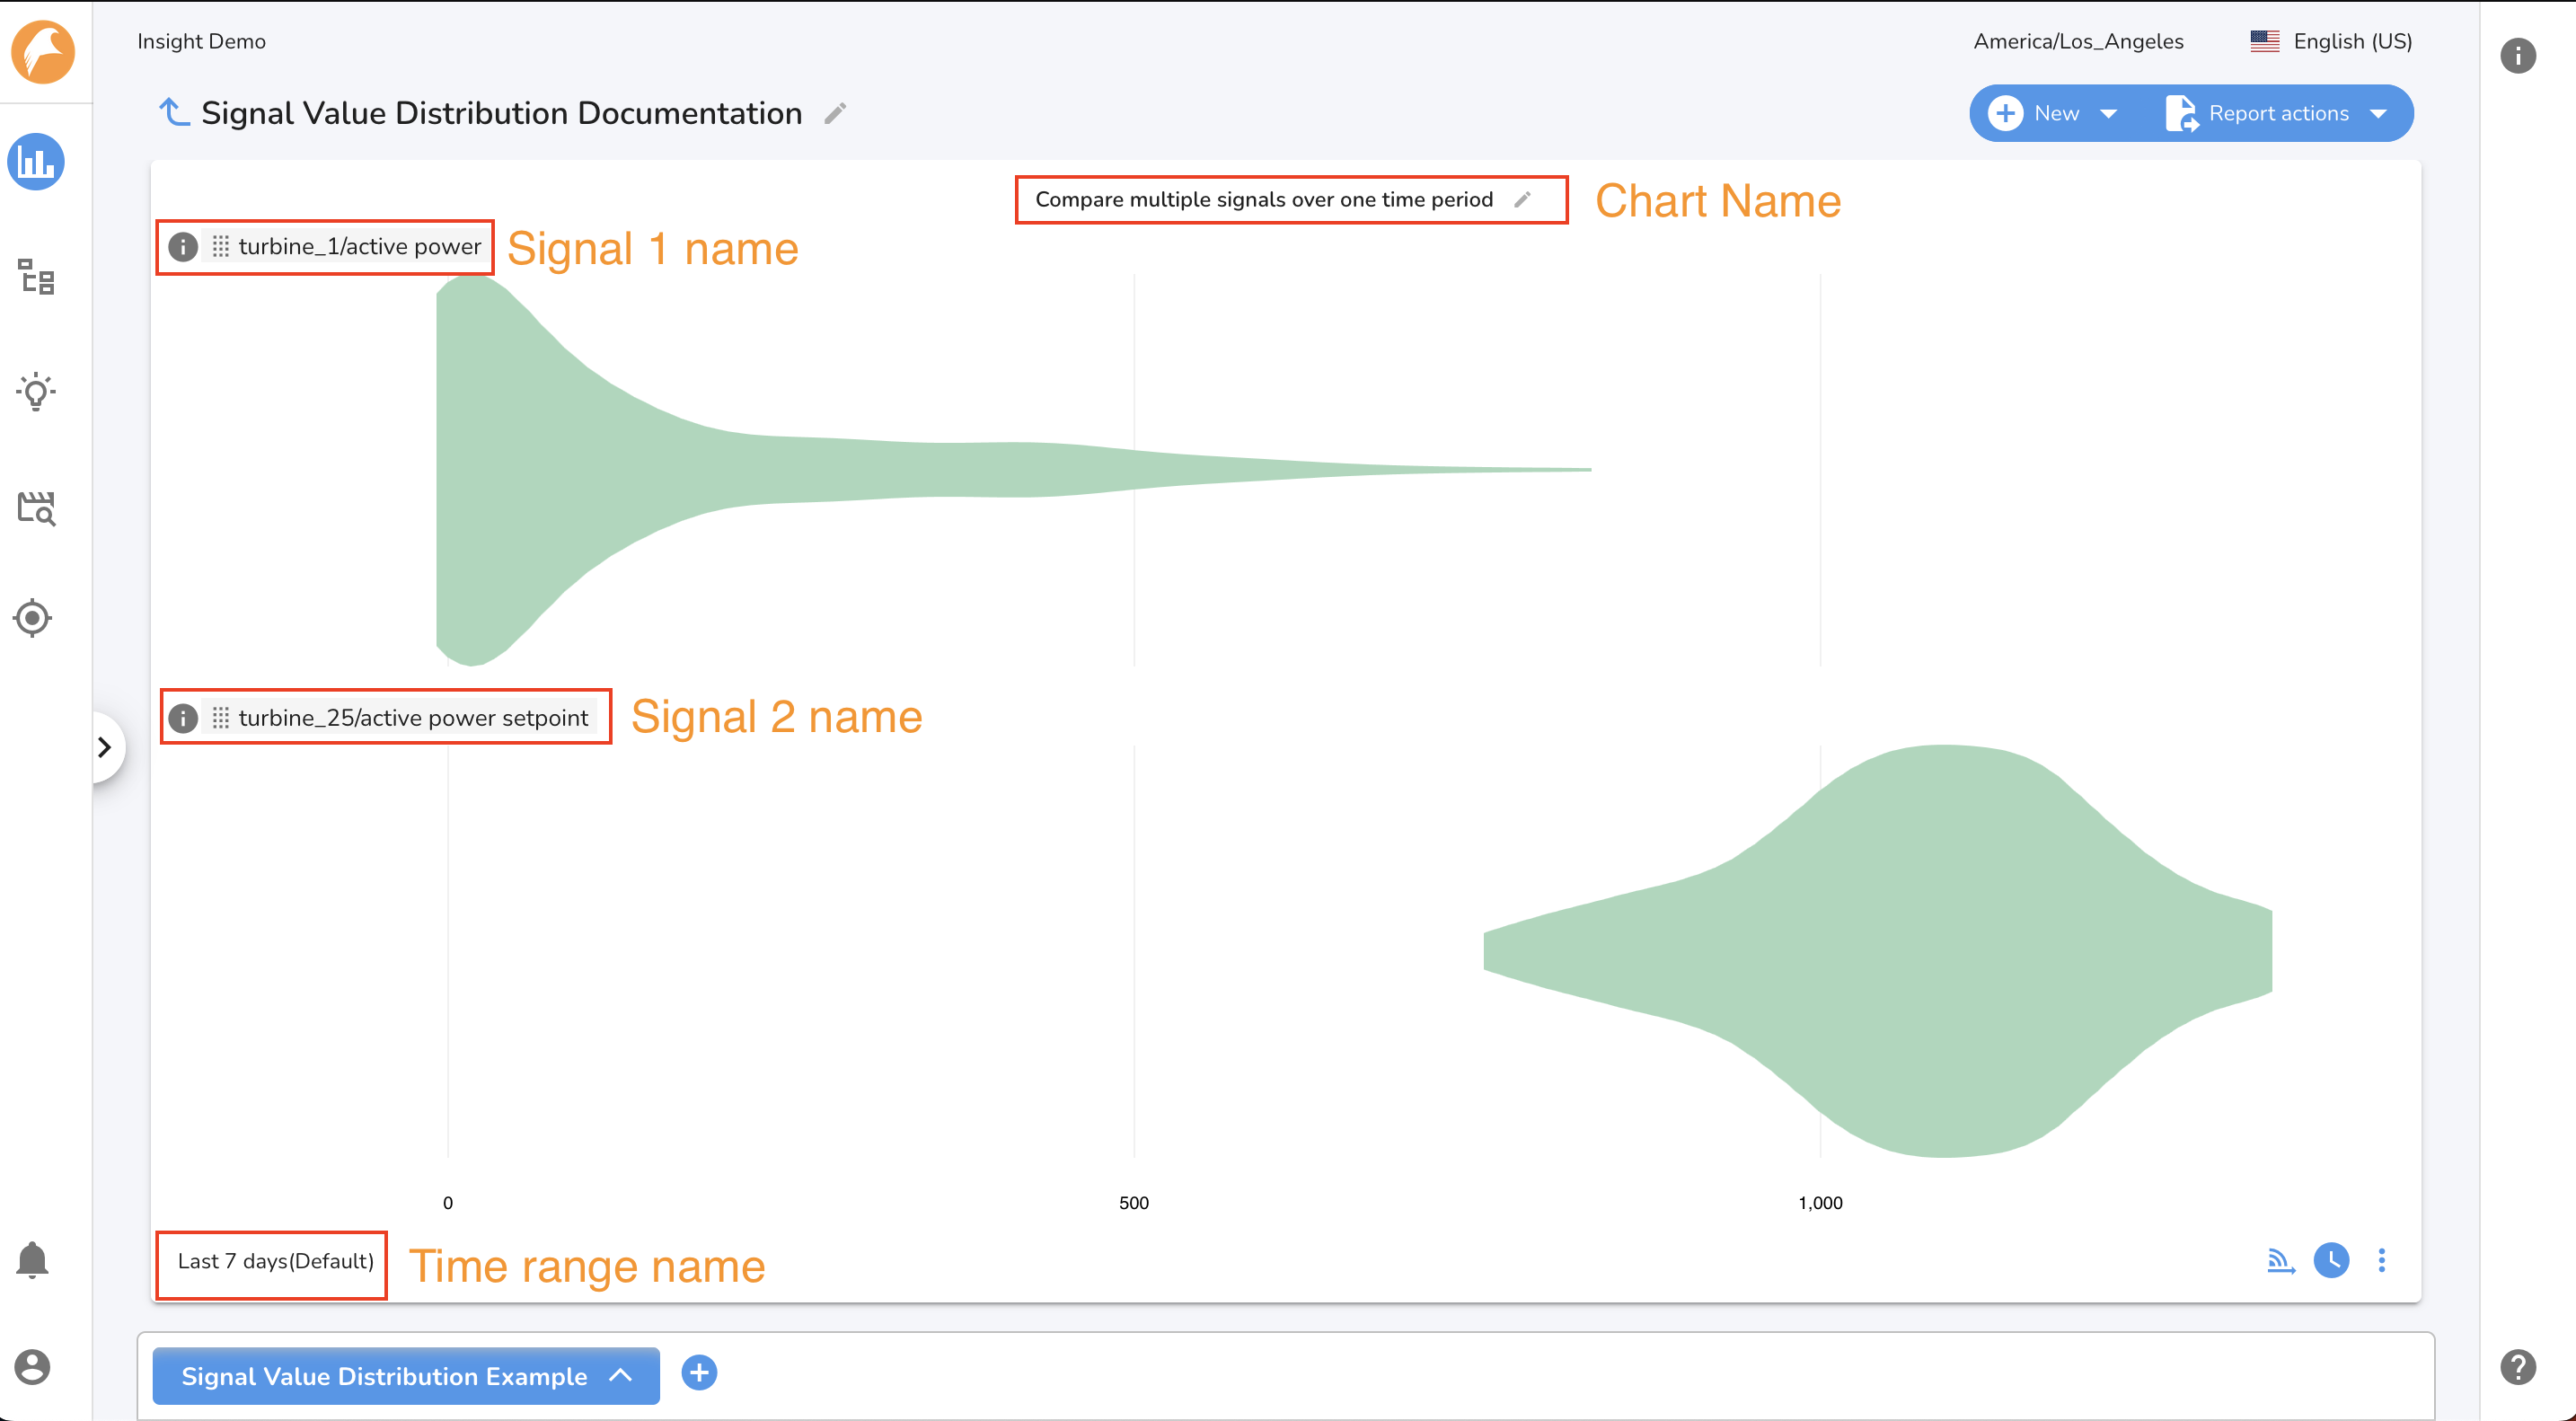
Compare multiple signals over one time range
This SVD chart type enables you to add 1 or more signals to the chart, and compare their distributions for a single time range. This chart type is best used when you are interested in comparing the distribution of multiple signals for one time range.
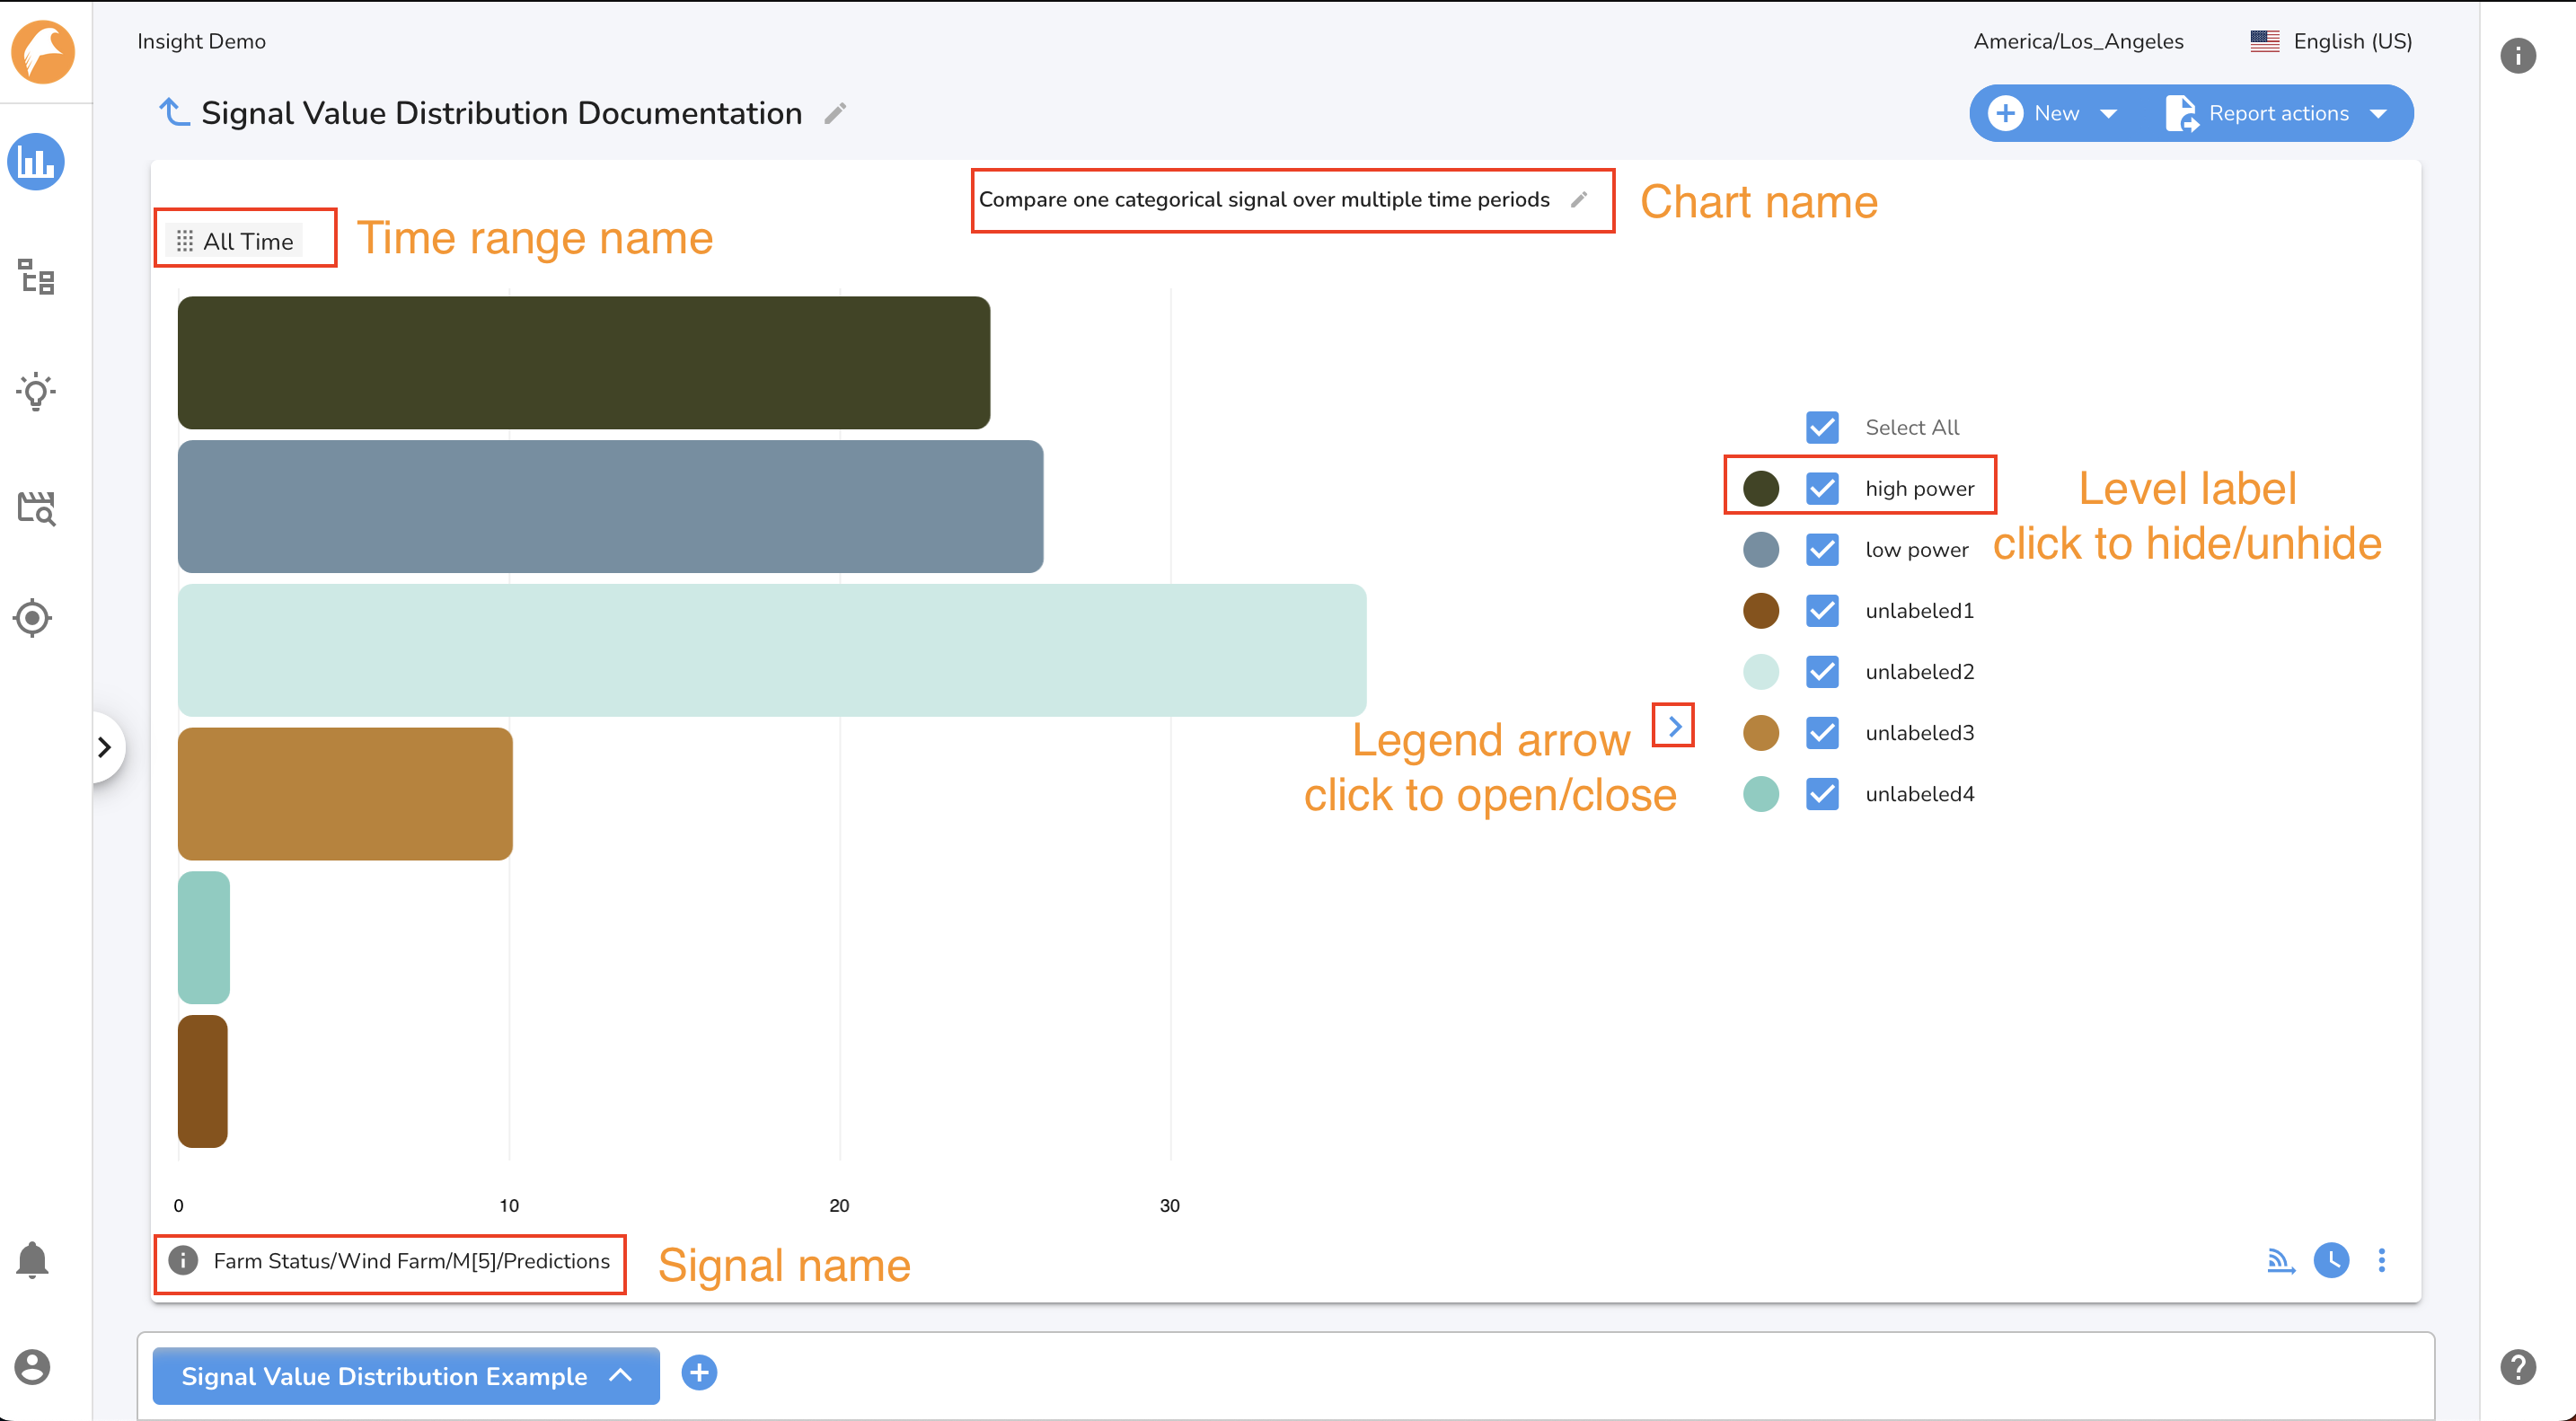
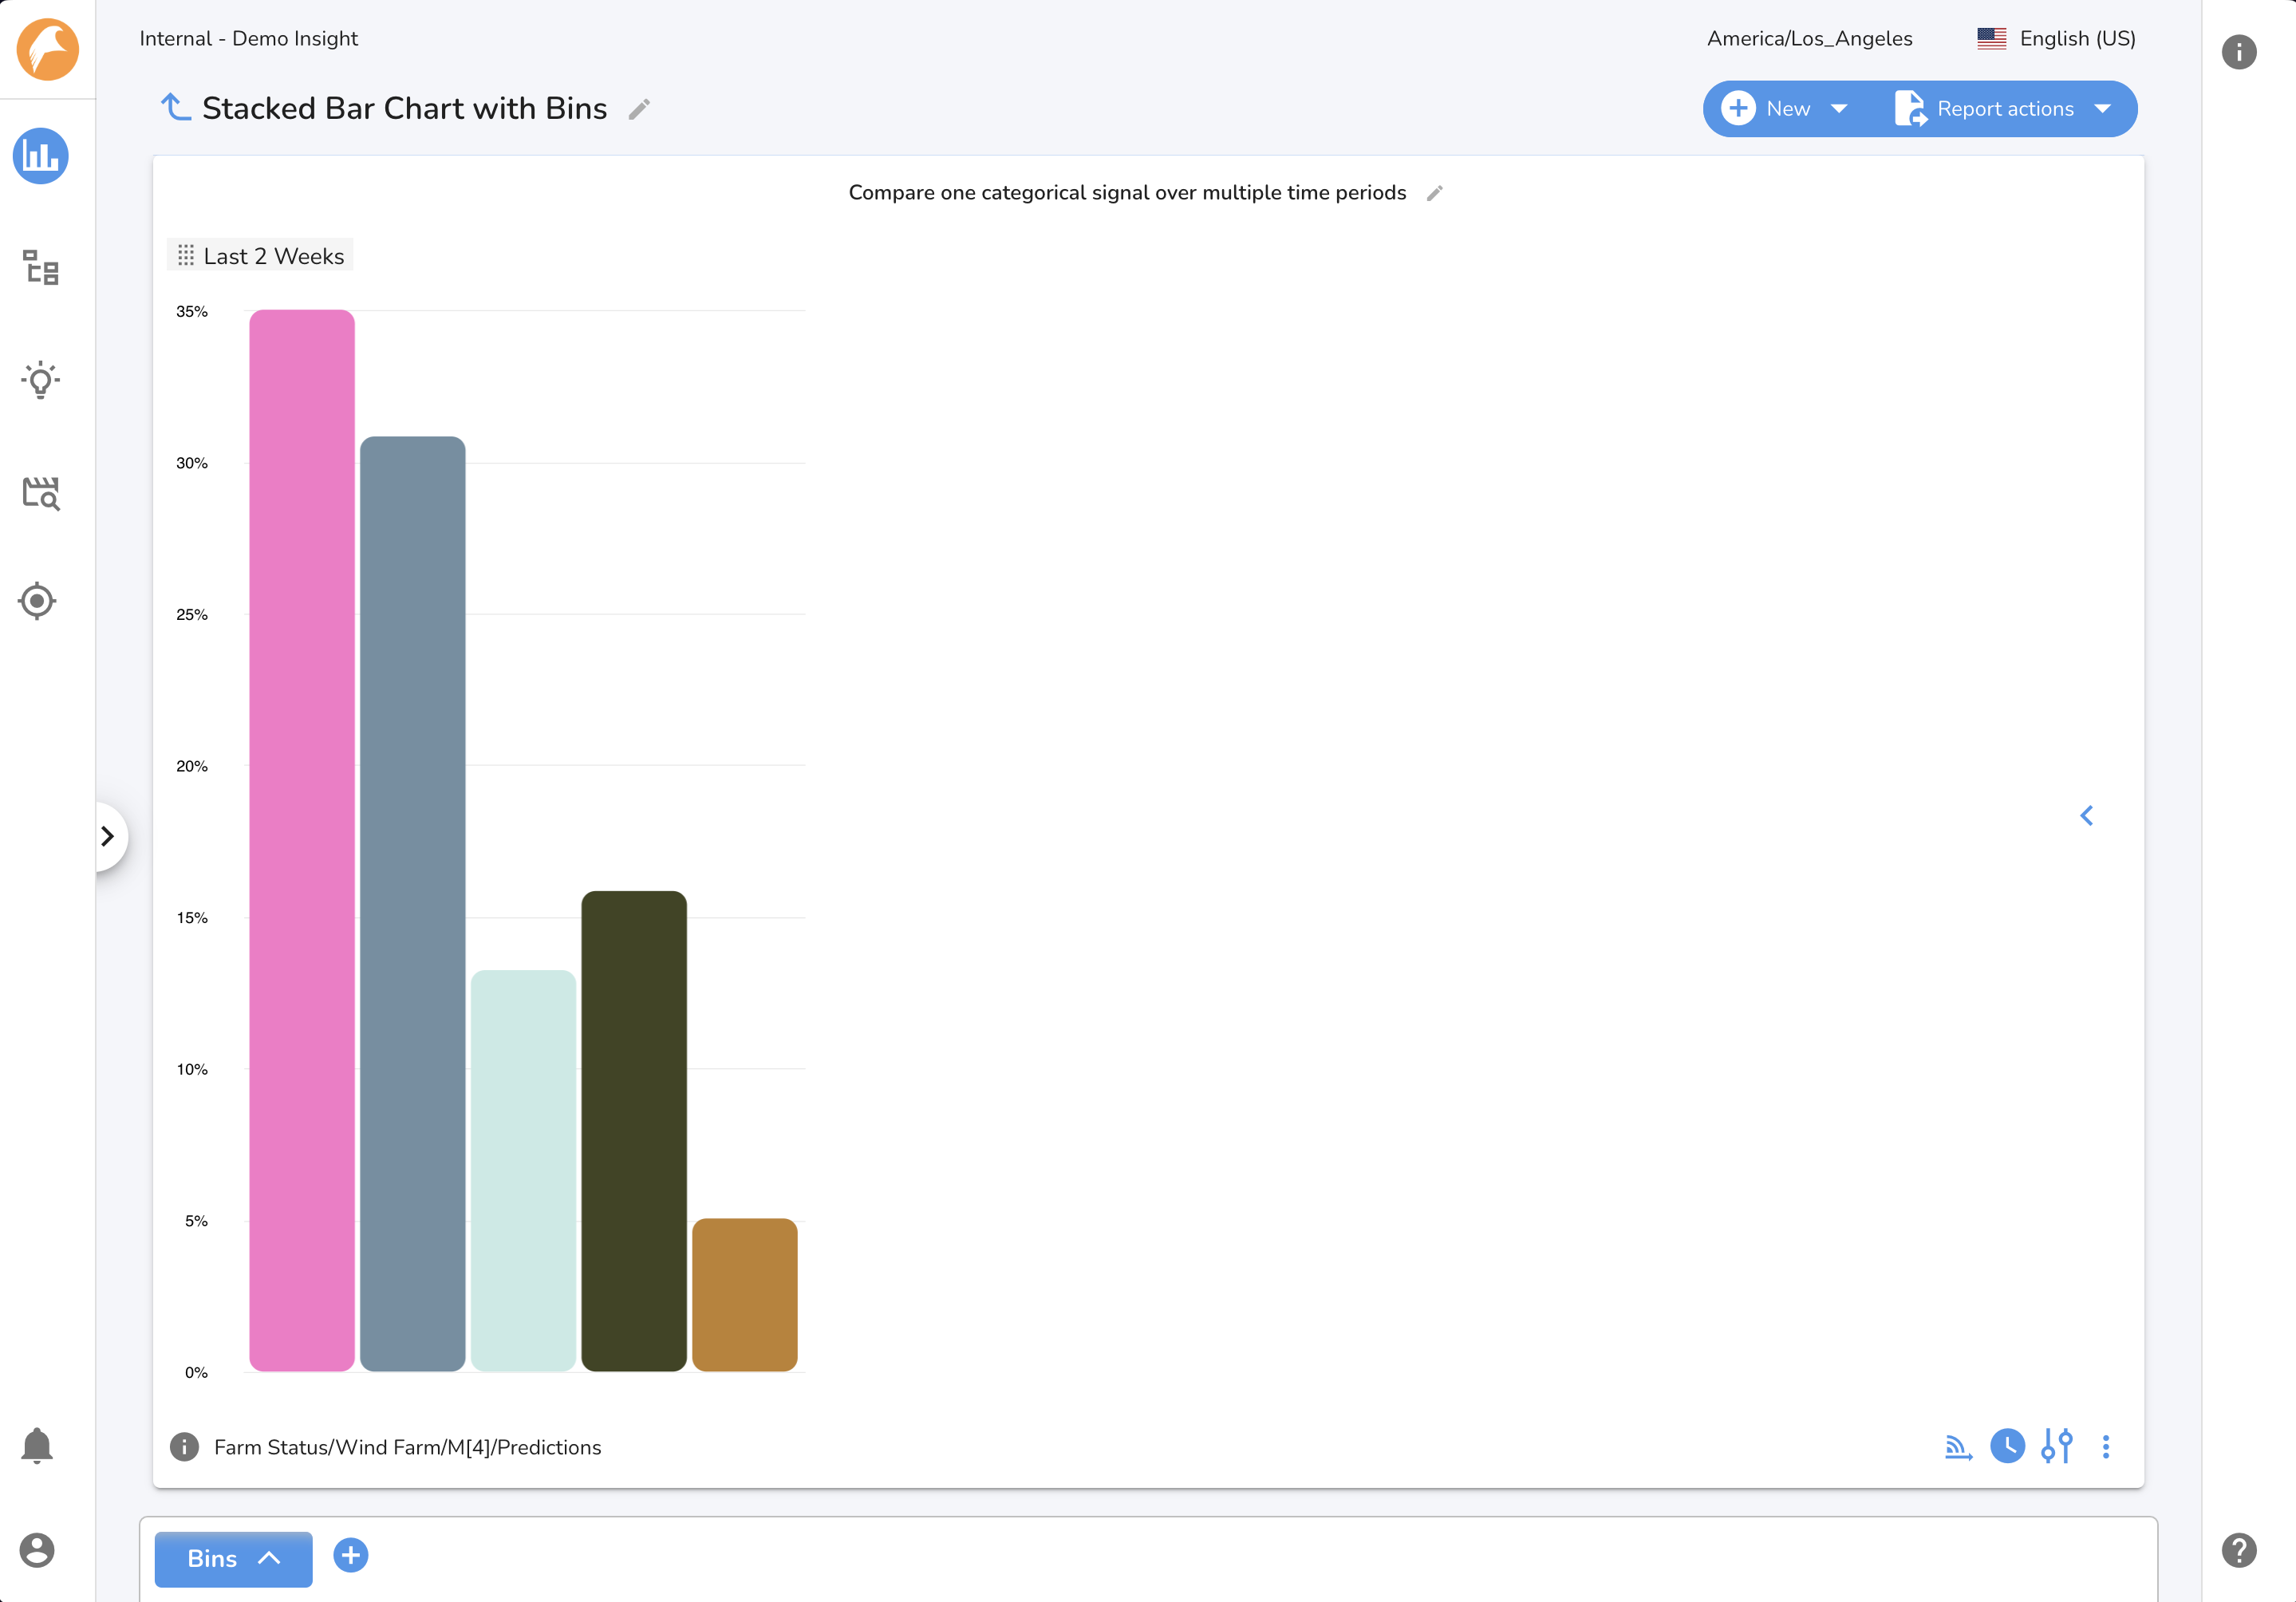
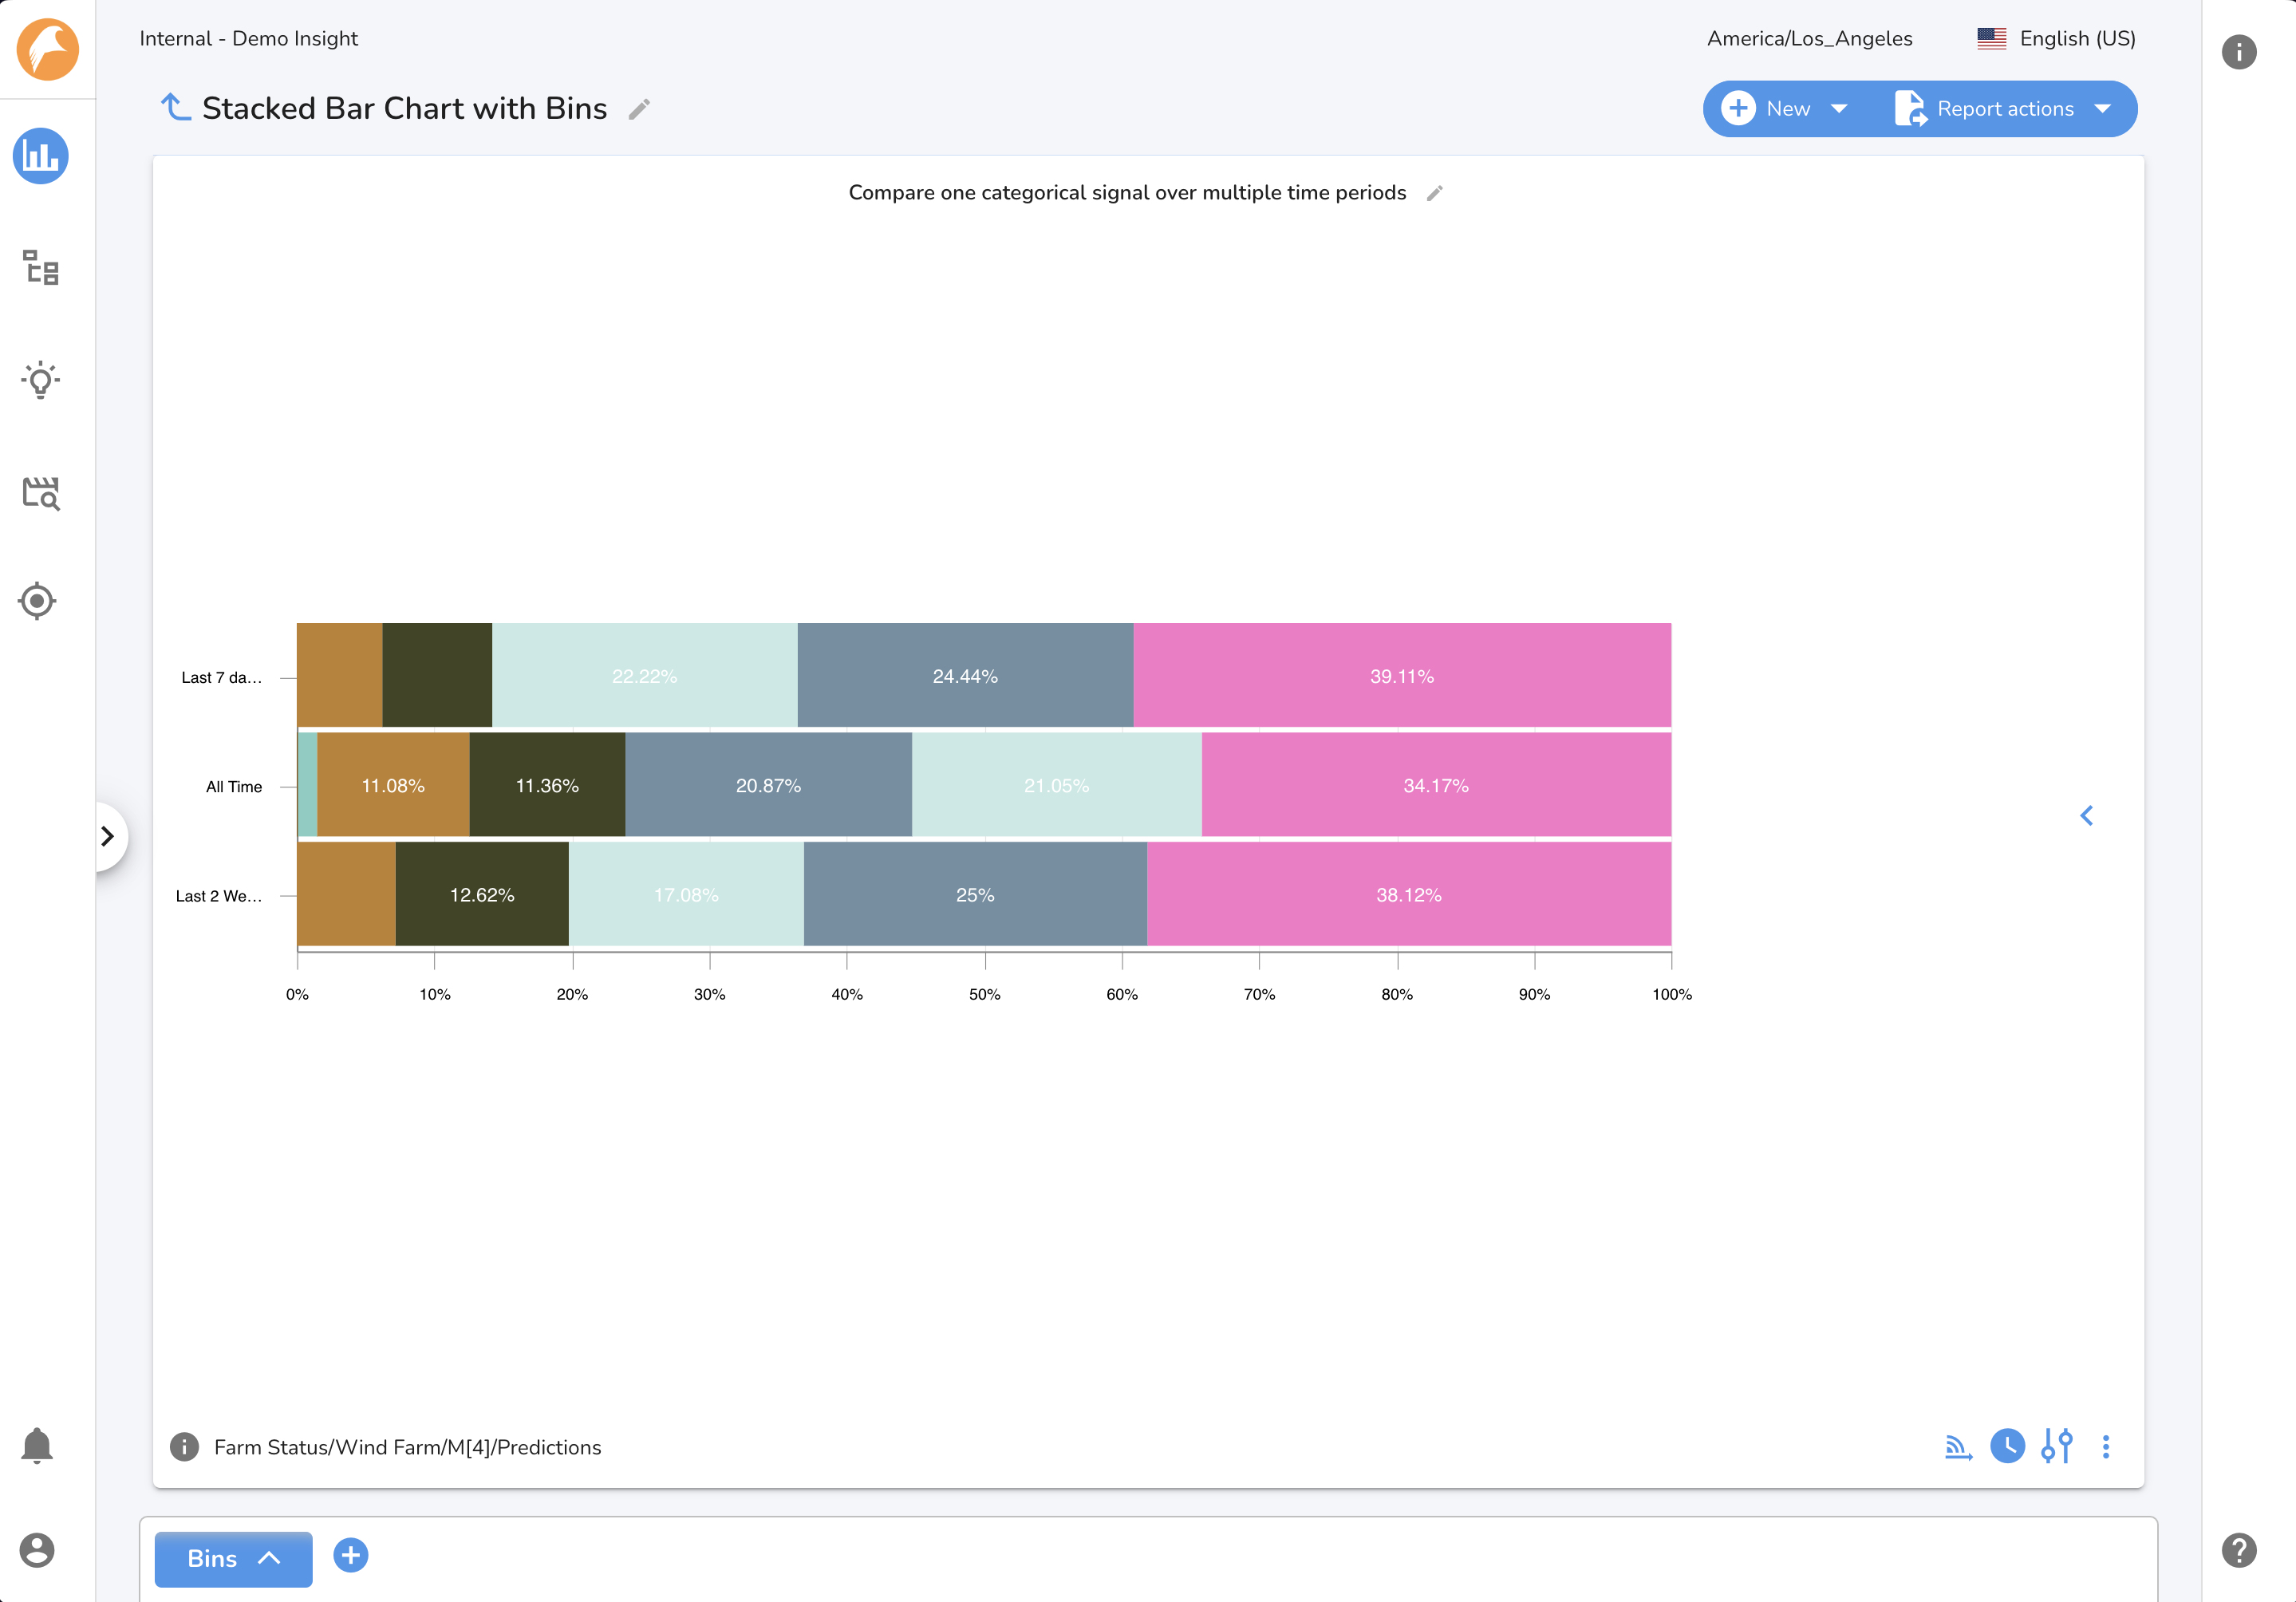
Compare one categorical signal over multiple time periods
This SVD chart type enables you to compare a single categorical signal across 1 or more time ranges. A categorical signal takes on specific discrete values, or labels, as distinct from continuous numeric signals. Examples of signal types to use with categorical SVDs are model outputs, production or maintenance signals, or binary signals.
The Categorical SVD has an optional legend which displays the names of the levels of the chart. The legend may be opened or closed with the arrow icon. A level on the chart may be hidden by clicking the checkbox next to its label in the legend.
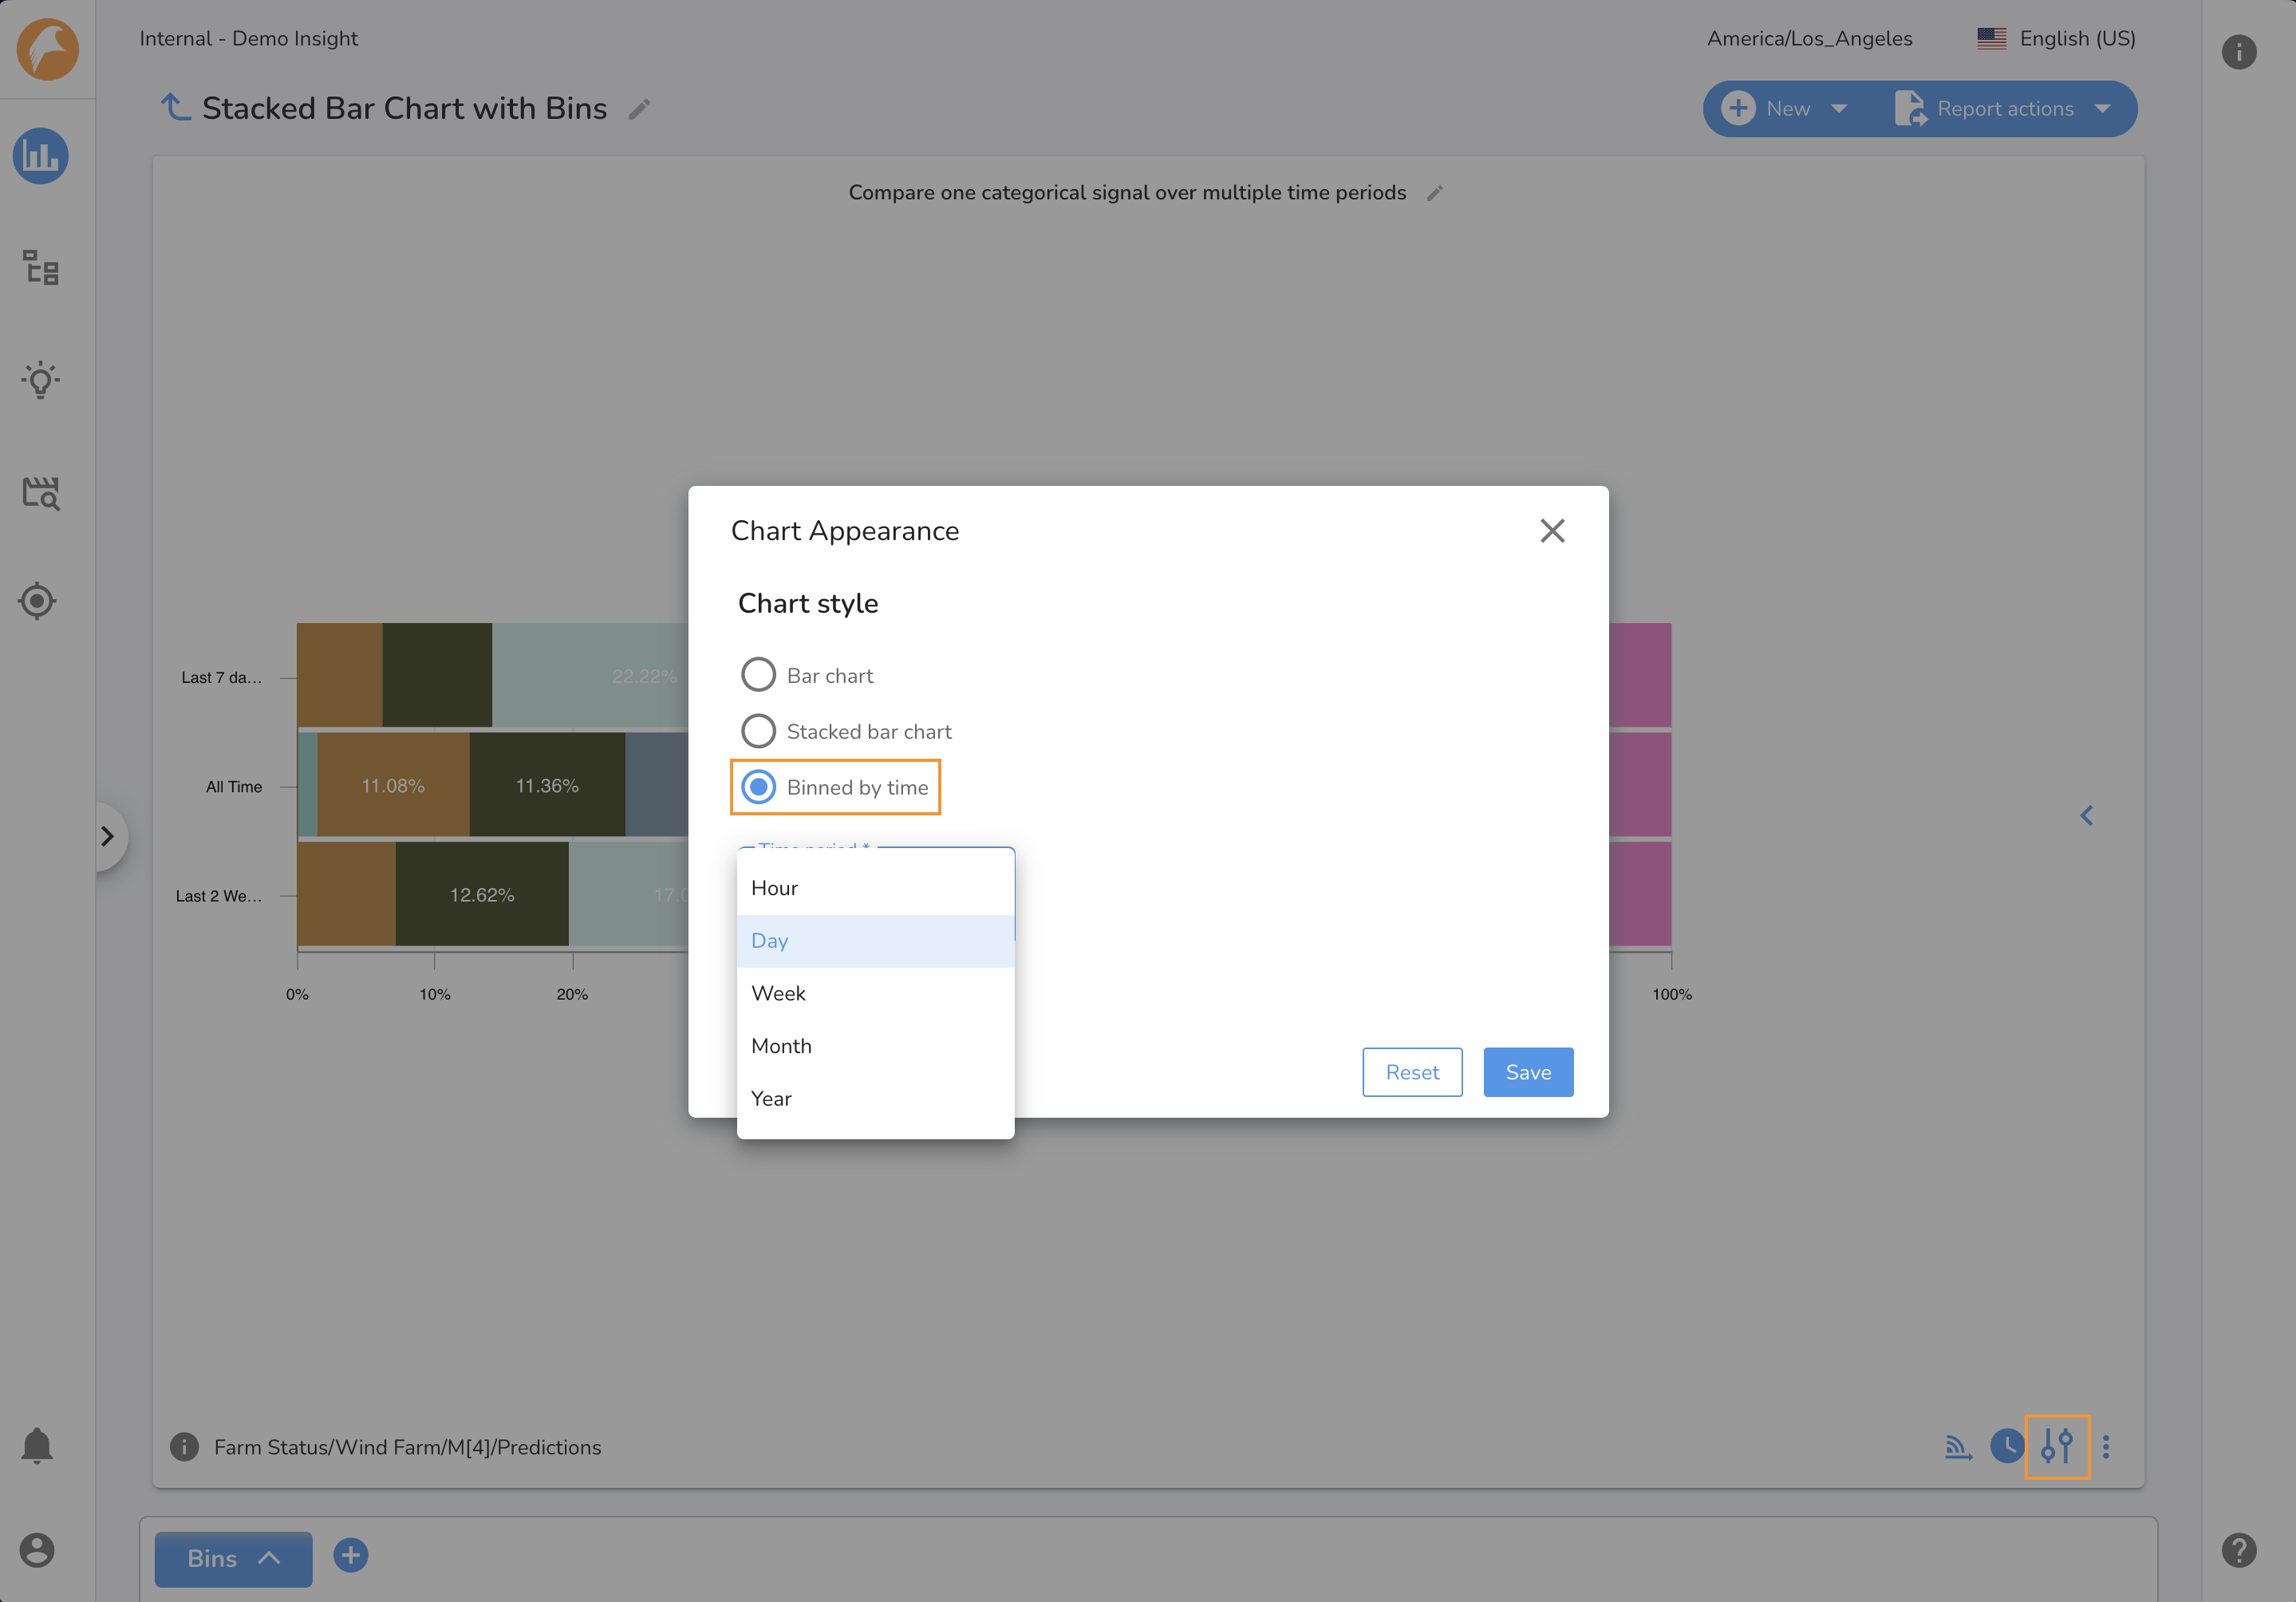
Categorical SVD chart Settings
The Chart Appearance Menu on the Categorical SVD enables you to format the chart to your purpose.
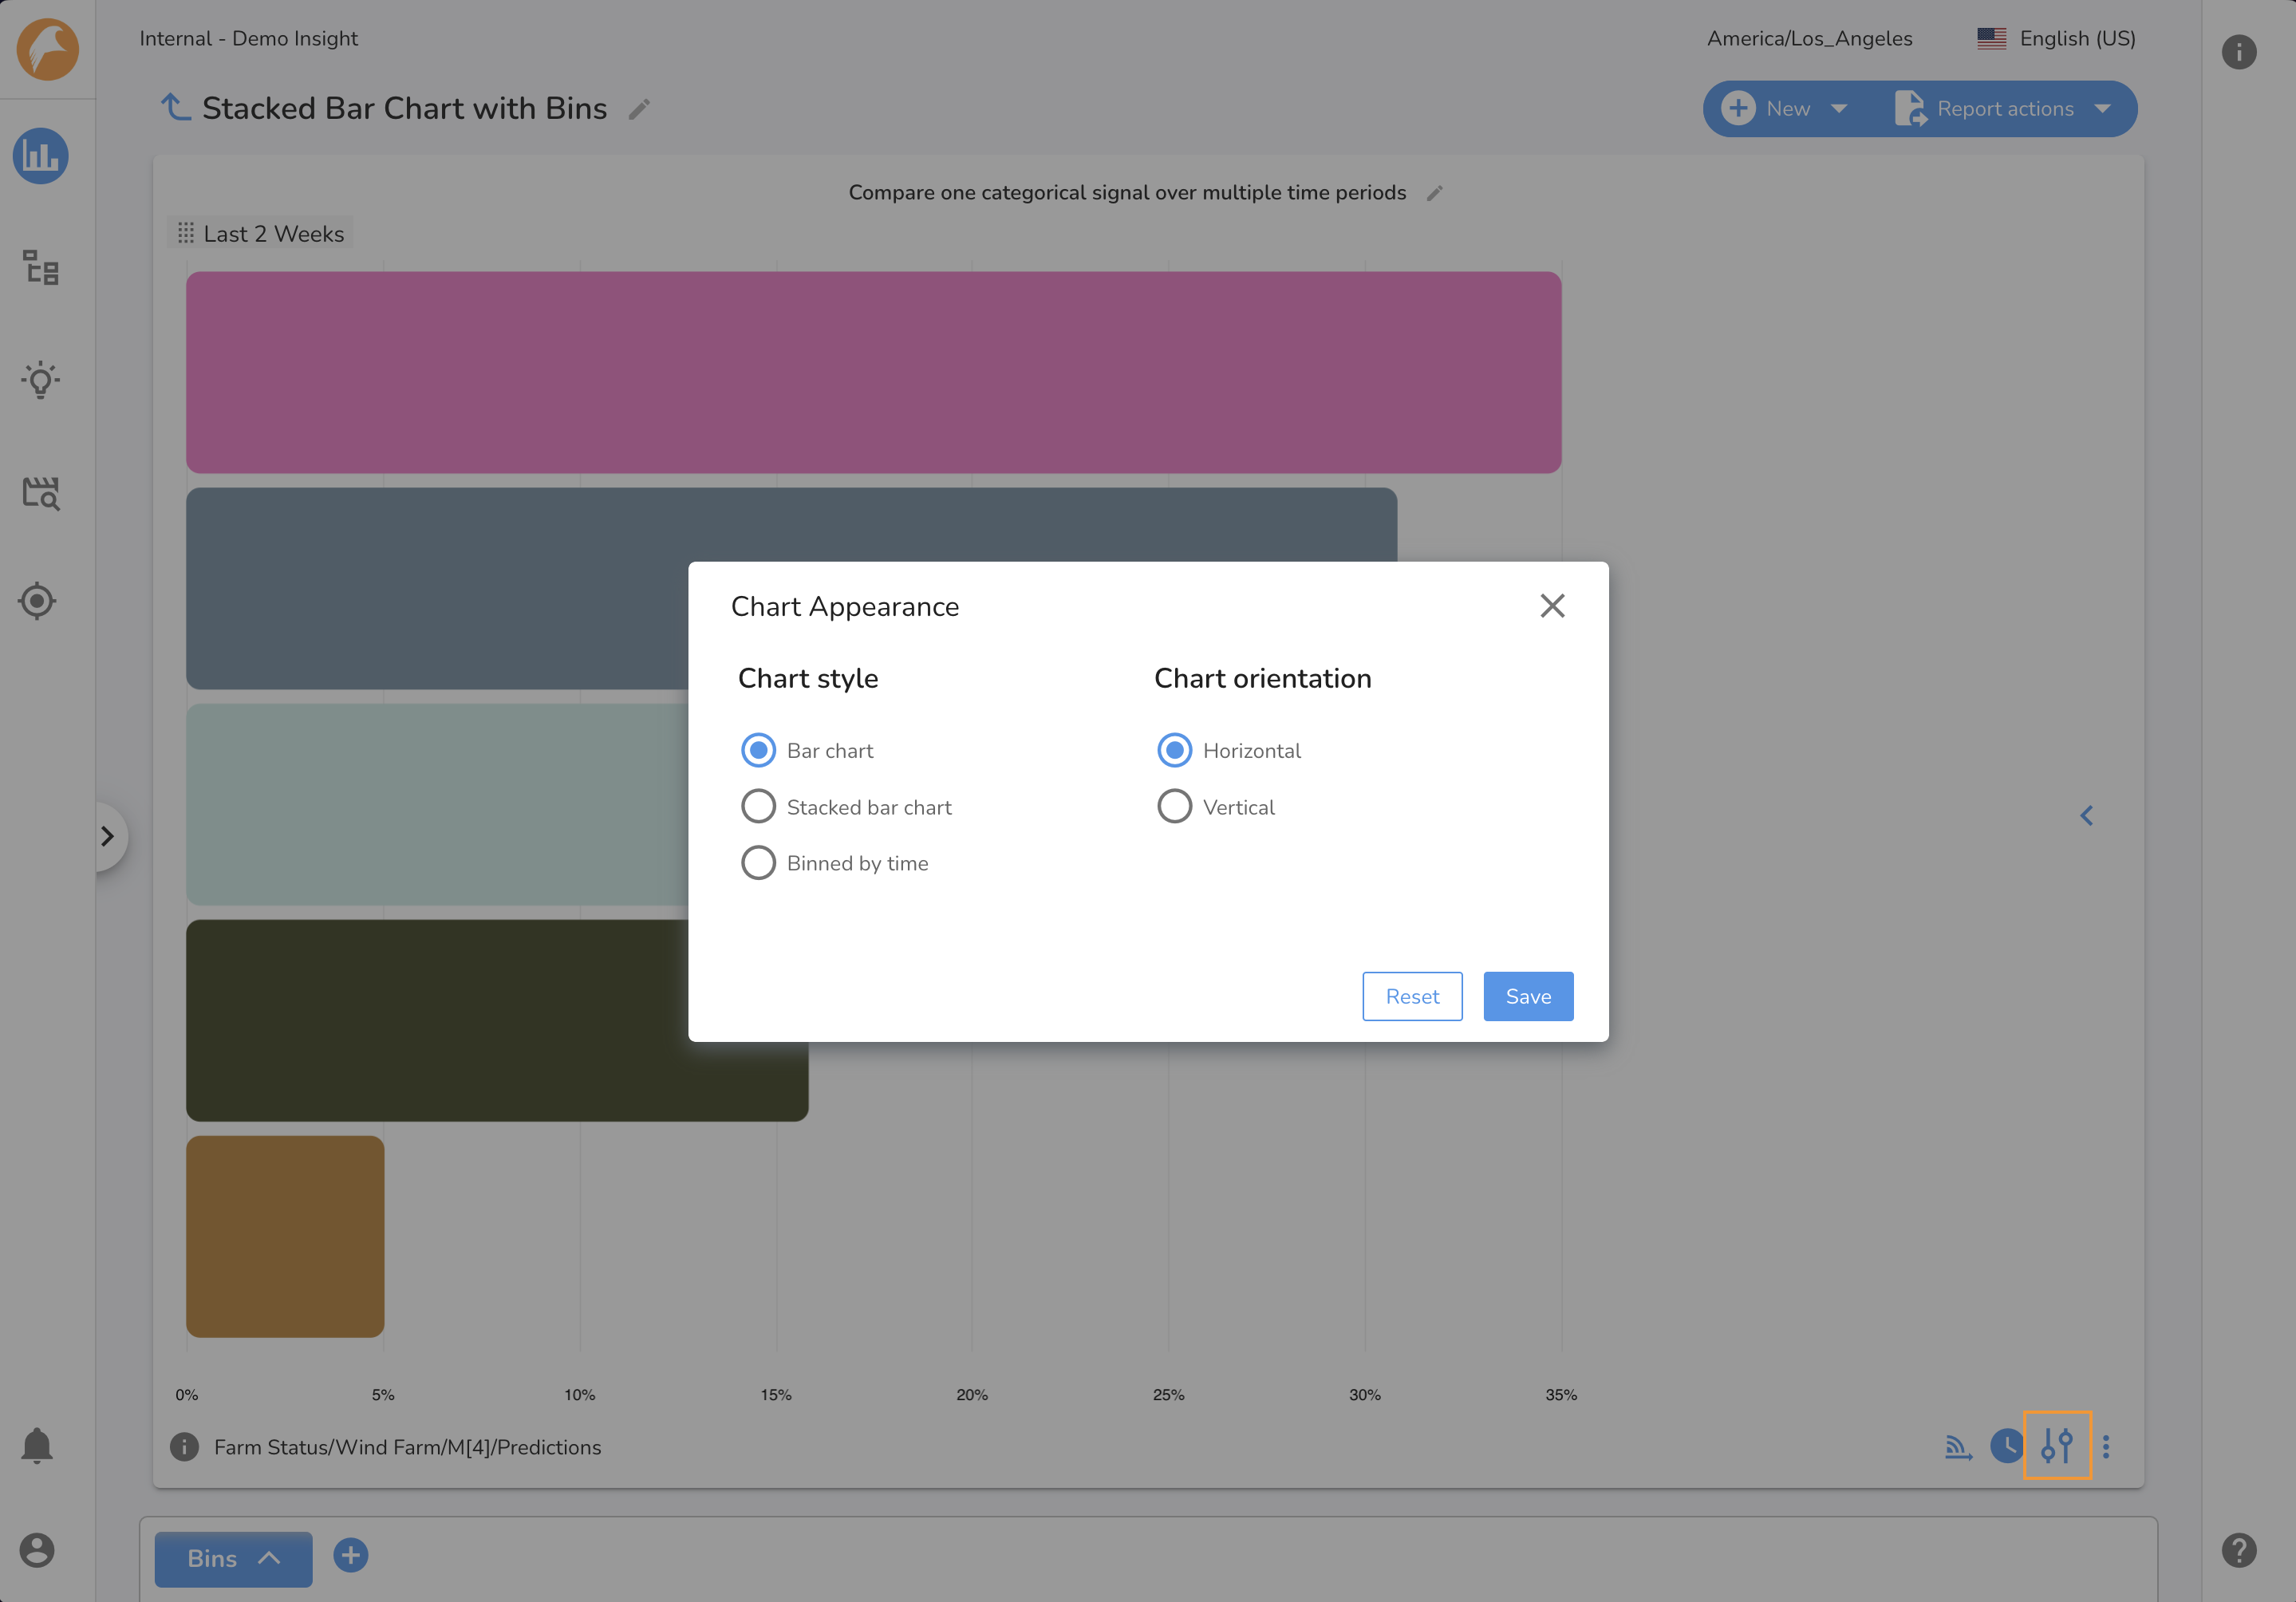
Orientation
You may set the orientation of bar charts between horizontal and vertical. This applies to both normal and stacked bar charts.
Stacked bar chart
You may choose between normal and stacked bar charts. In stacked bar chart mode, each selected time range is a unique column in the chart. Stacked bar charts can be in either horizontal or vertical orientation.
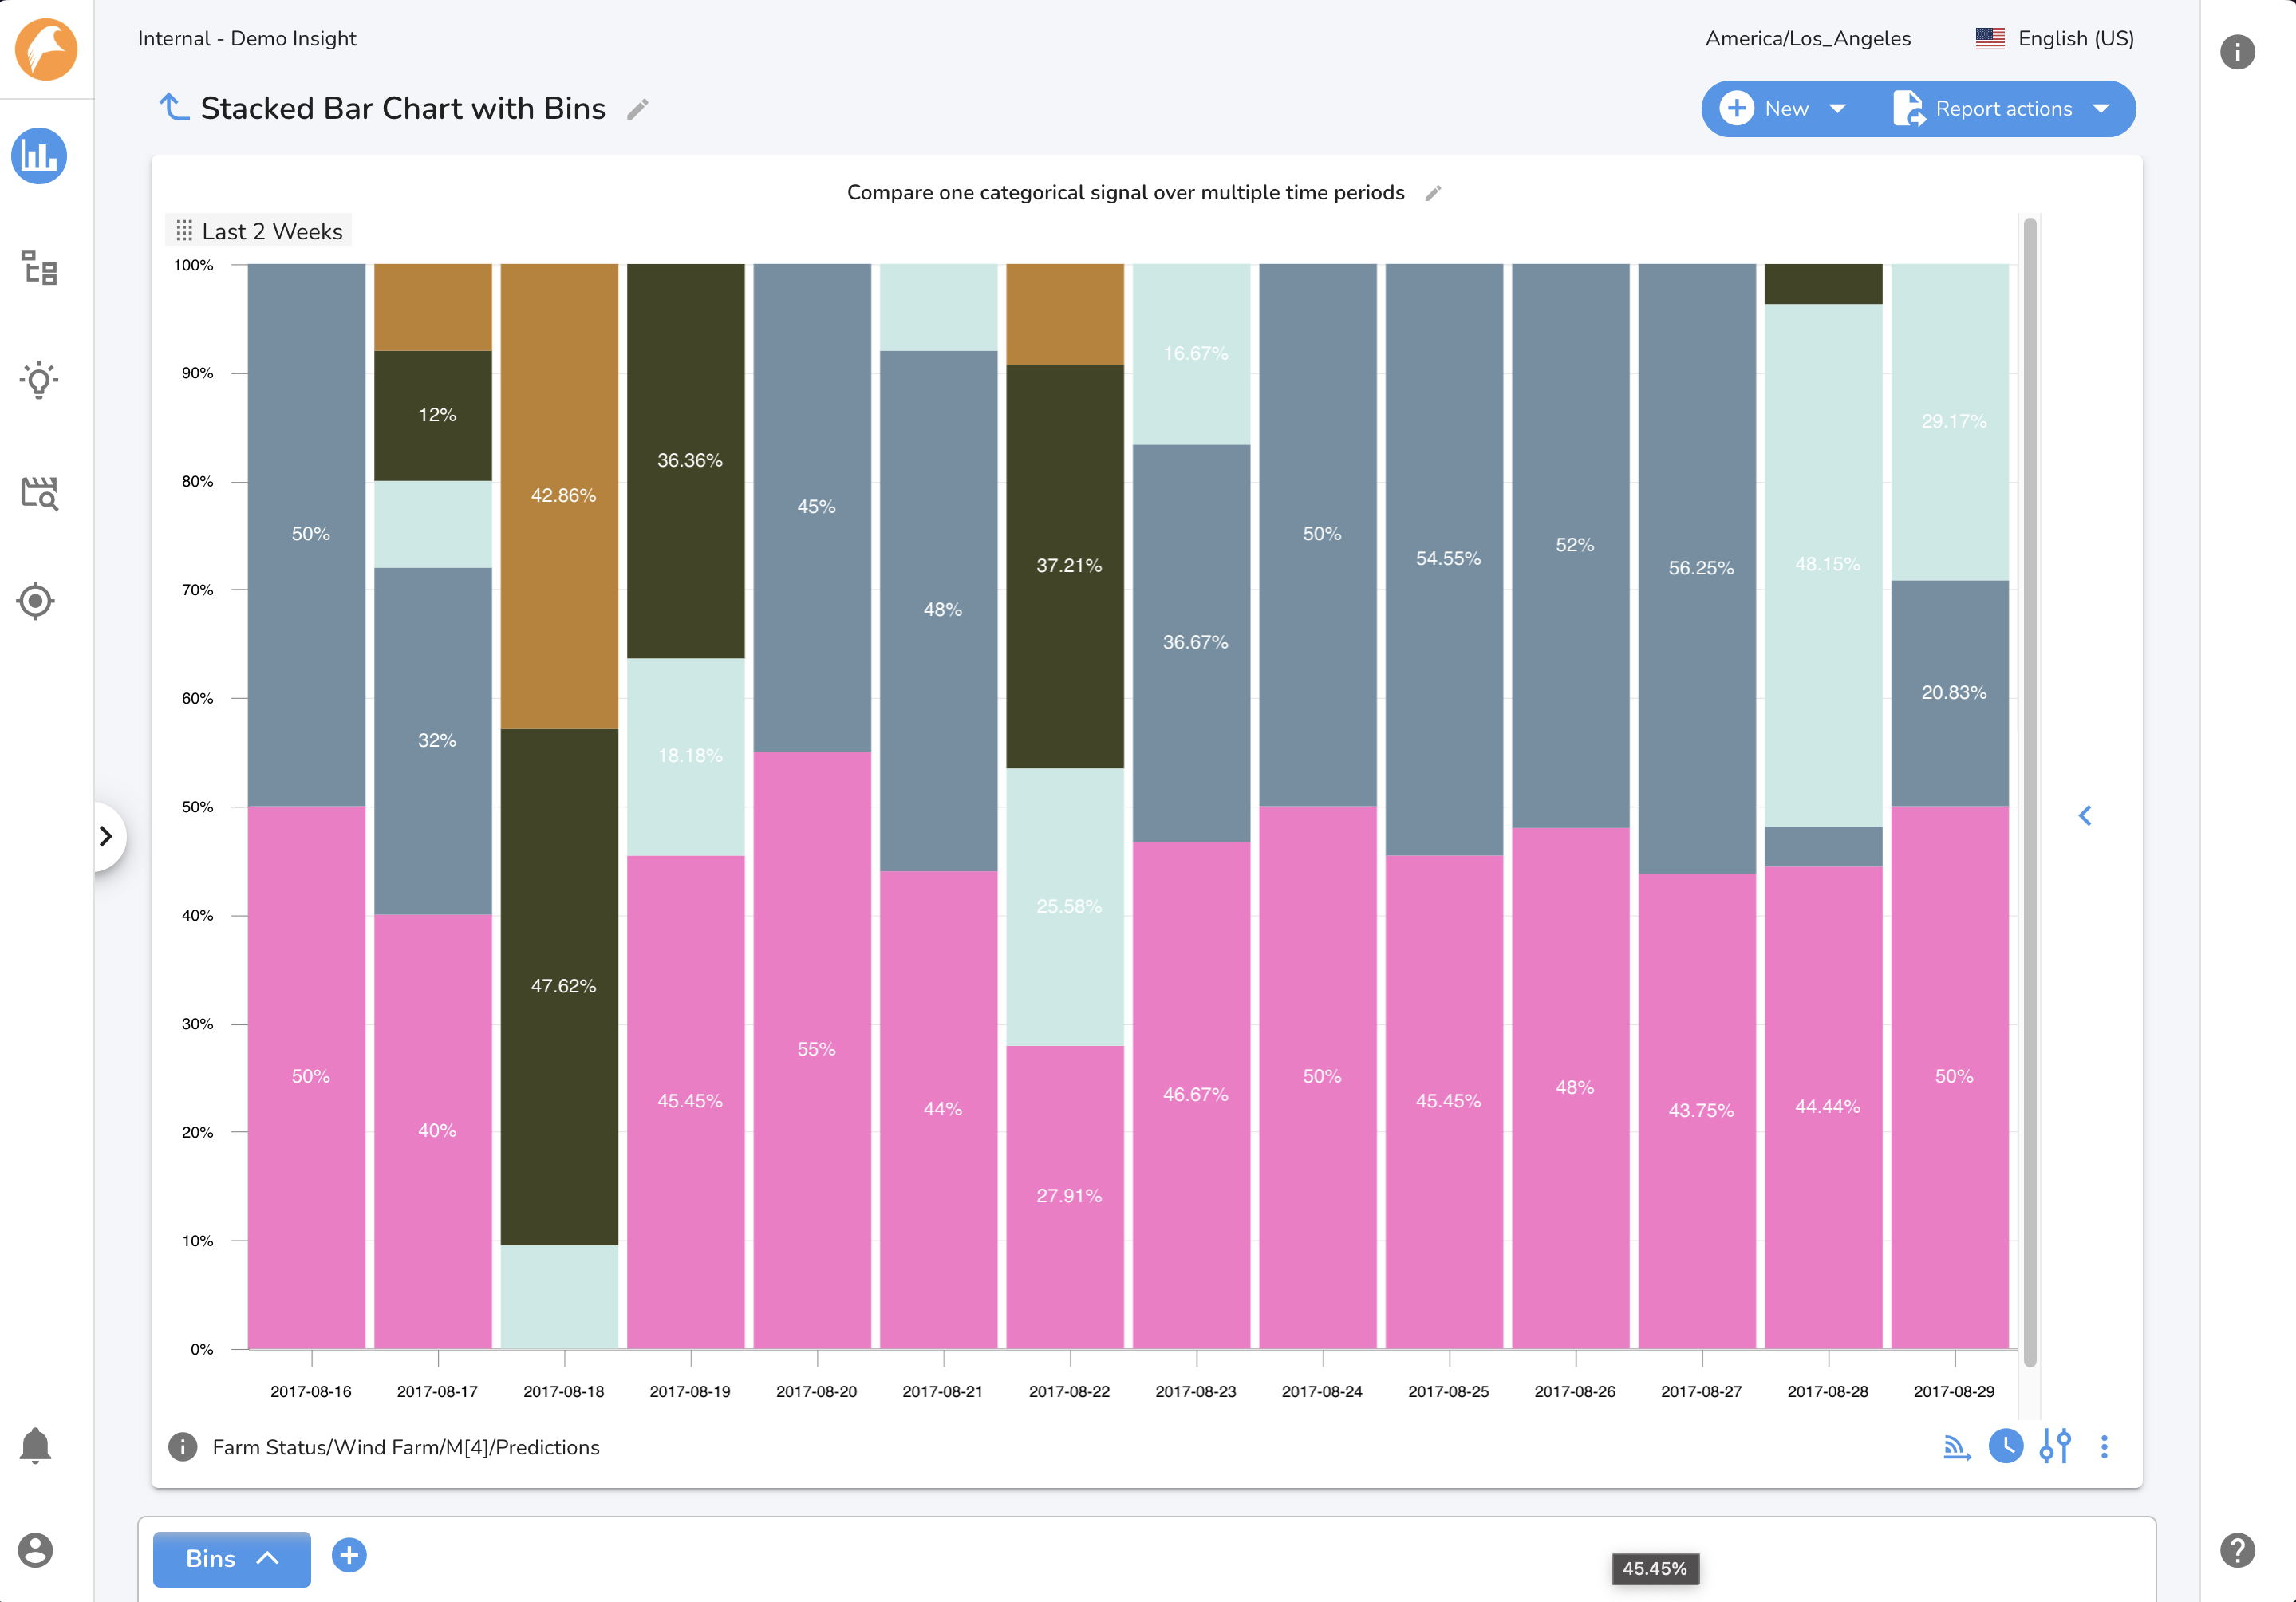
Binning by time
It is often useful to see how the distribution of a signal evolves within a time range. The bin by time feature enables you to select a unit of time to break down the selected time range. You may bin by hour, day, week, month, or year. Only one time range may be used when binning by time.
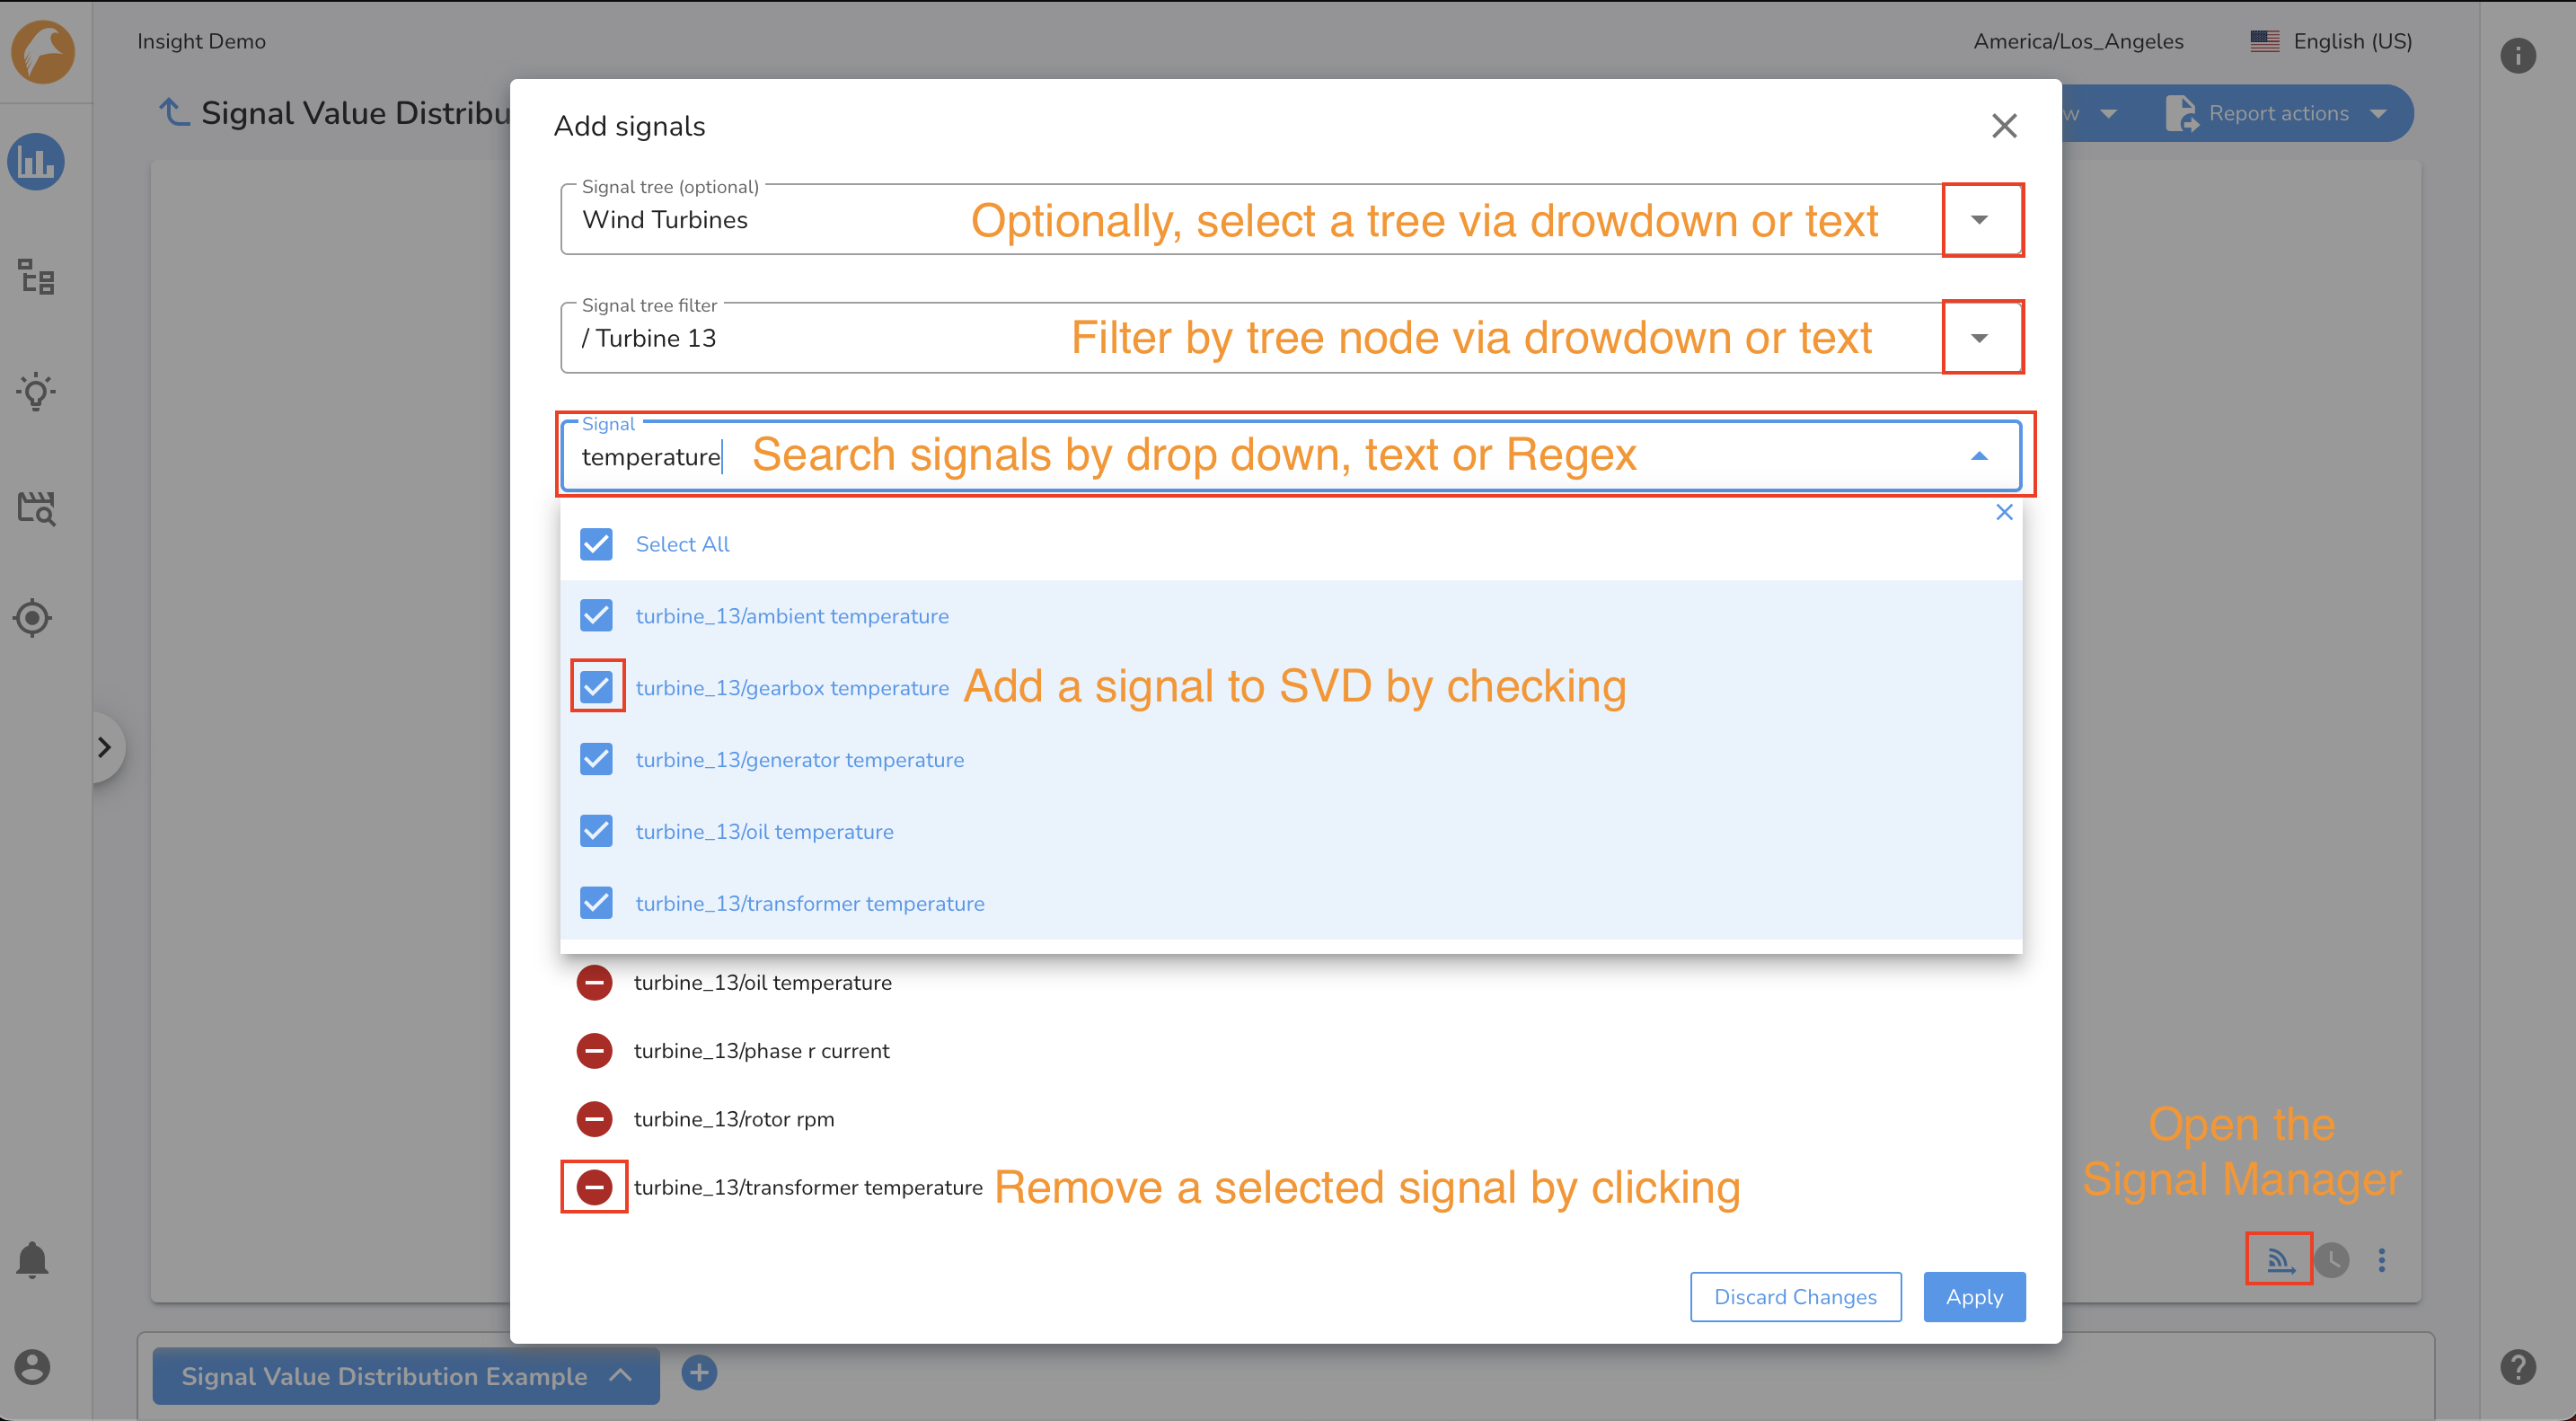
Adding signals to an SVD chart
To add a signal to an SVD chart:
- Click the Signal Manager icon
- Search for a signal using the tree filters and search bar
- Select 1 or more signals (depending on the SVD type)
- Click the Apply button
Note: when selecting signals for a Categorical SVD the Signal Manager will only display categorical signals.
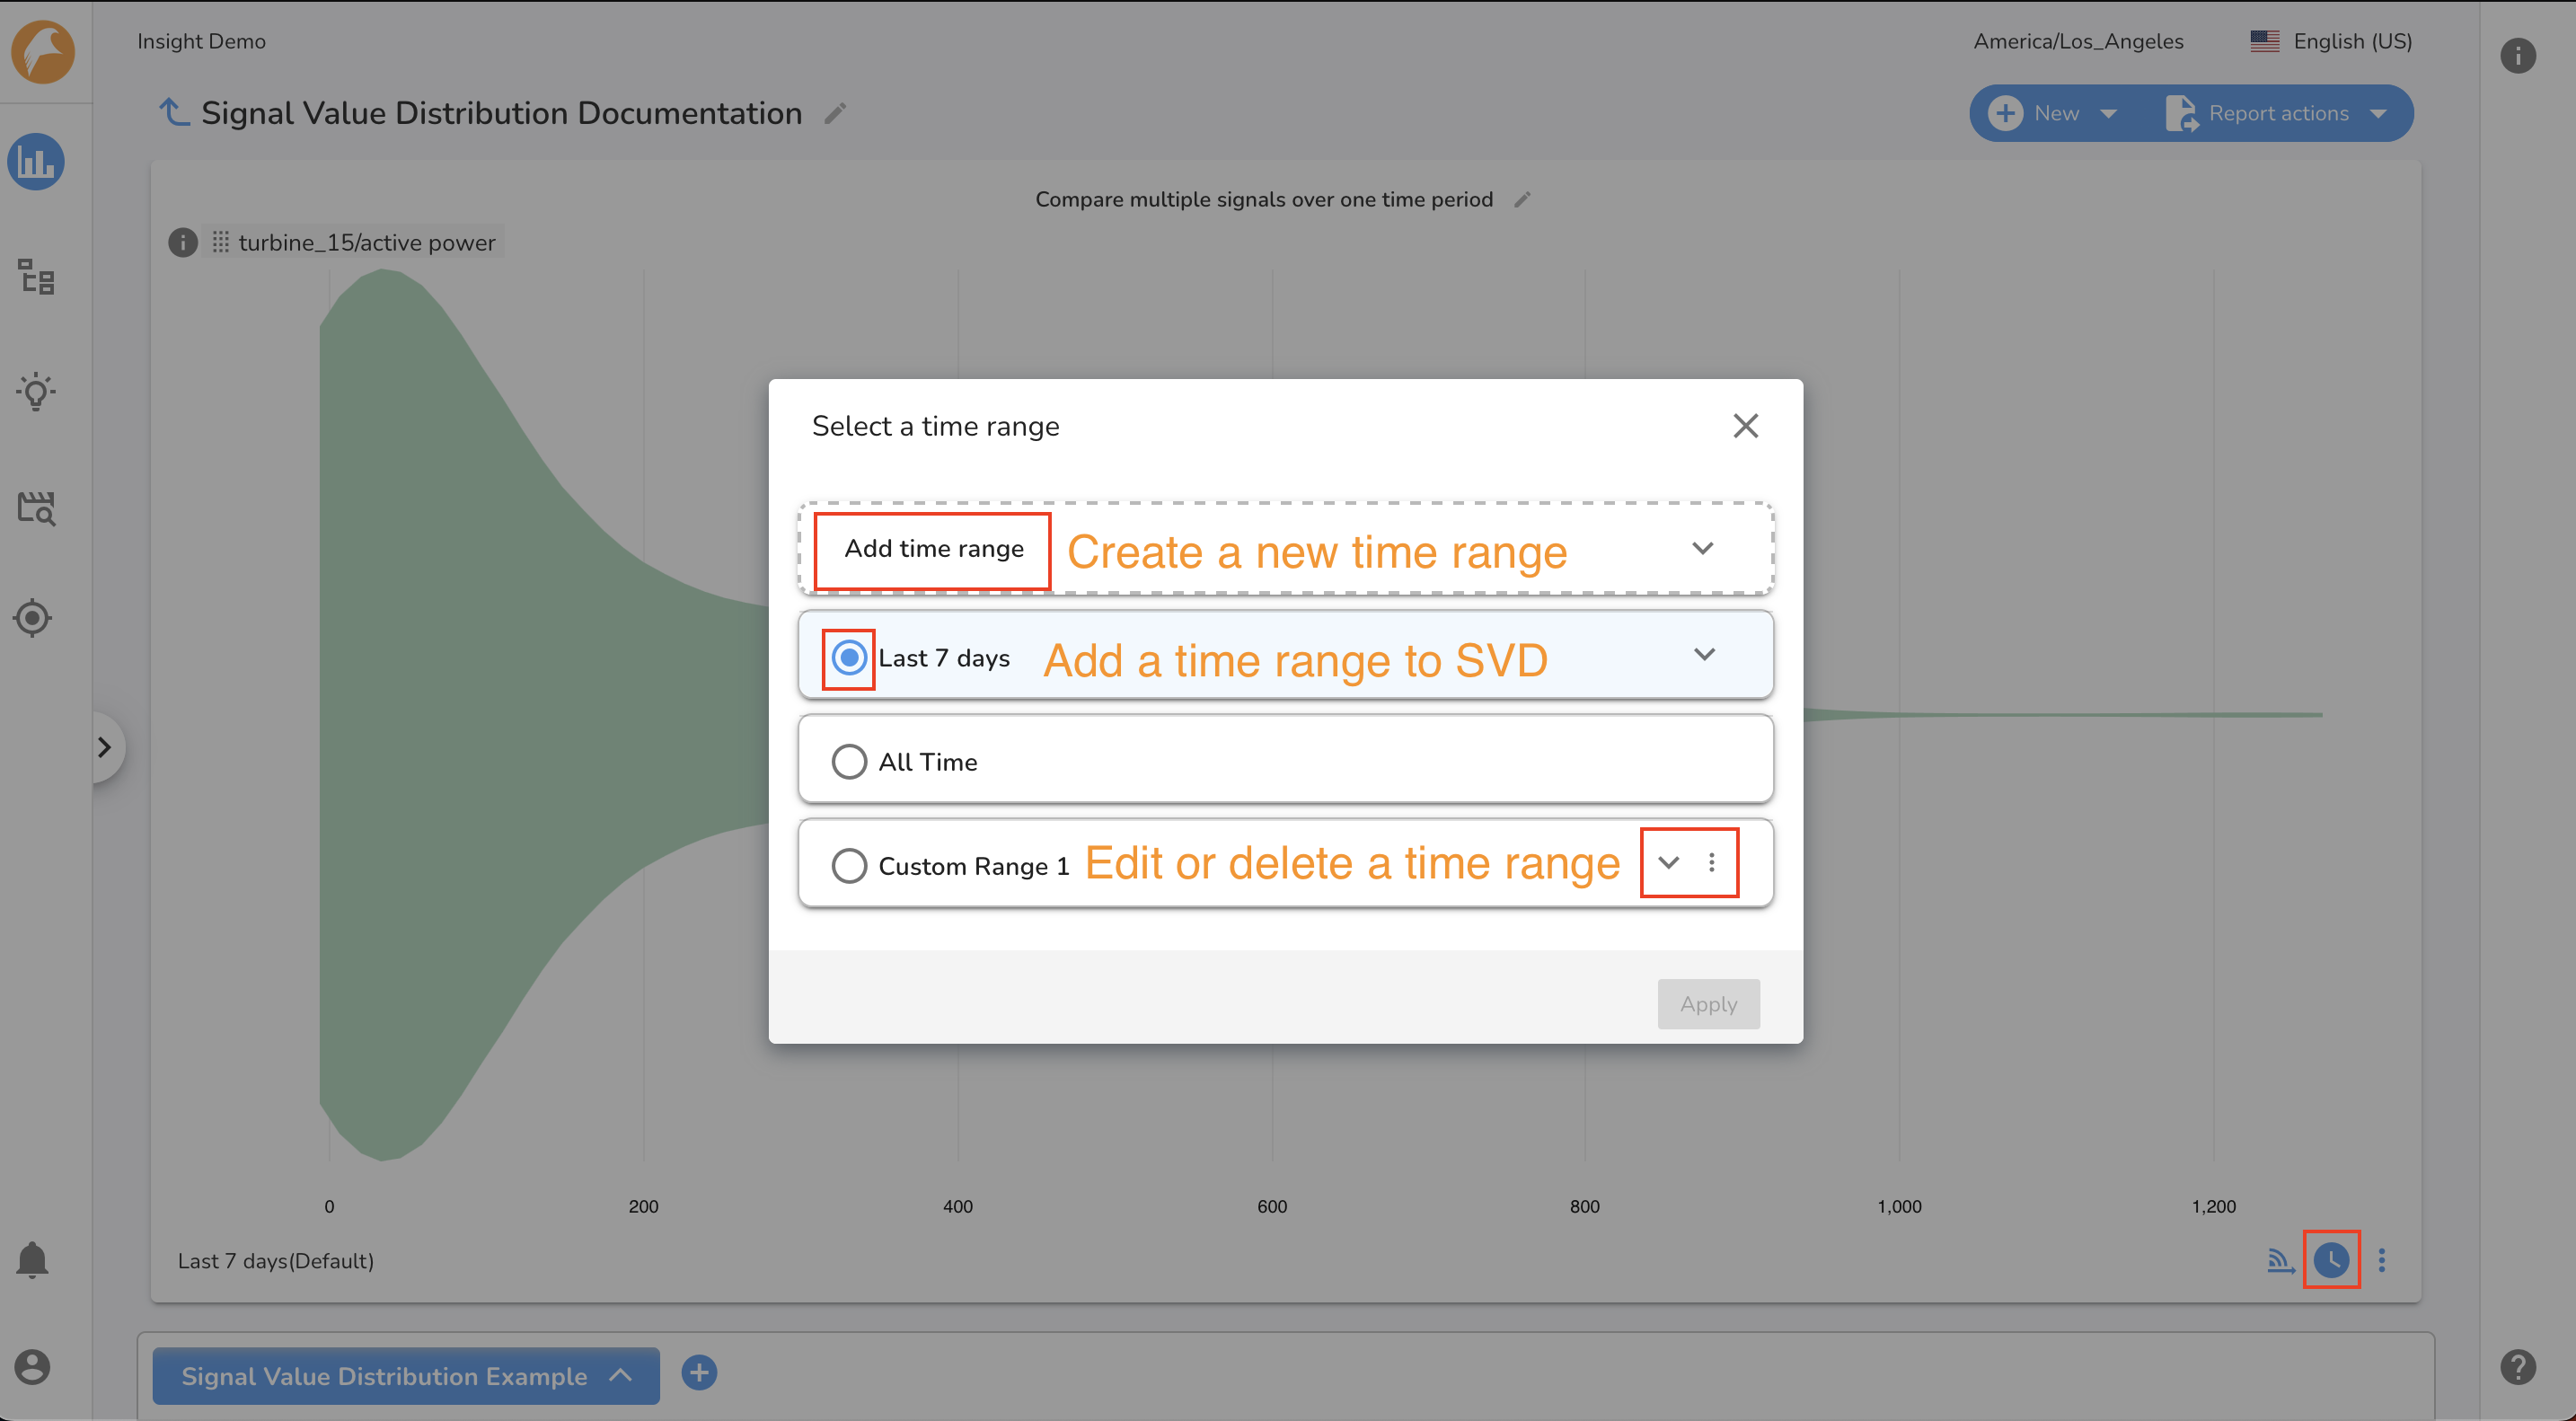
Adding time ranges to an SVD Chart
Once at least one signal has been selected, you may select one or more time ranges for the chart (depending on the chart type).
To add a time range to an SVD chart:
- Select the Time Range Manager
- Choose one or more time ranges and click the Apply button
- Optionally, you may create additional time ranges by clicking the Add Time Range option
- Click the Apply button
Formattting the SVD chart
Rearranging the Charts
When an SVD has more than one distribution displayed, the order of the distributions can be updated by dragging and dropping the drag icon.
Signal Information
Click the info icon to open up the Signal Information Pane with additional details about a signal.
Naming theSVD* chart*
The name of an SVD chart may be edited by clicking the pencil icon. Click the check icon to save changes or the x icon to clear changes.
Clearing theSVD* settings*
You may reset or clear an SVD\'s settings by clicking the kebab menu and selecting clear settings.