Assessment Views
The Assessment page provides a unified view for all types of assessments (Anomalies, Patterns, Rules, Calculated). Use this page to monitor output, and input signals in real time.
Reference Signals
Add up to 50 reference signals to this section to aid in assessment interpretation. Reference signals help provide context for understanding assessment results.
Output Signals
This section displays the output signals generated by the assessment. The output signals varies based on the assessment type.
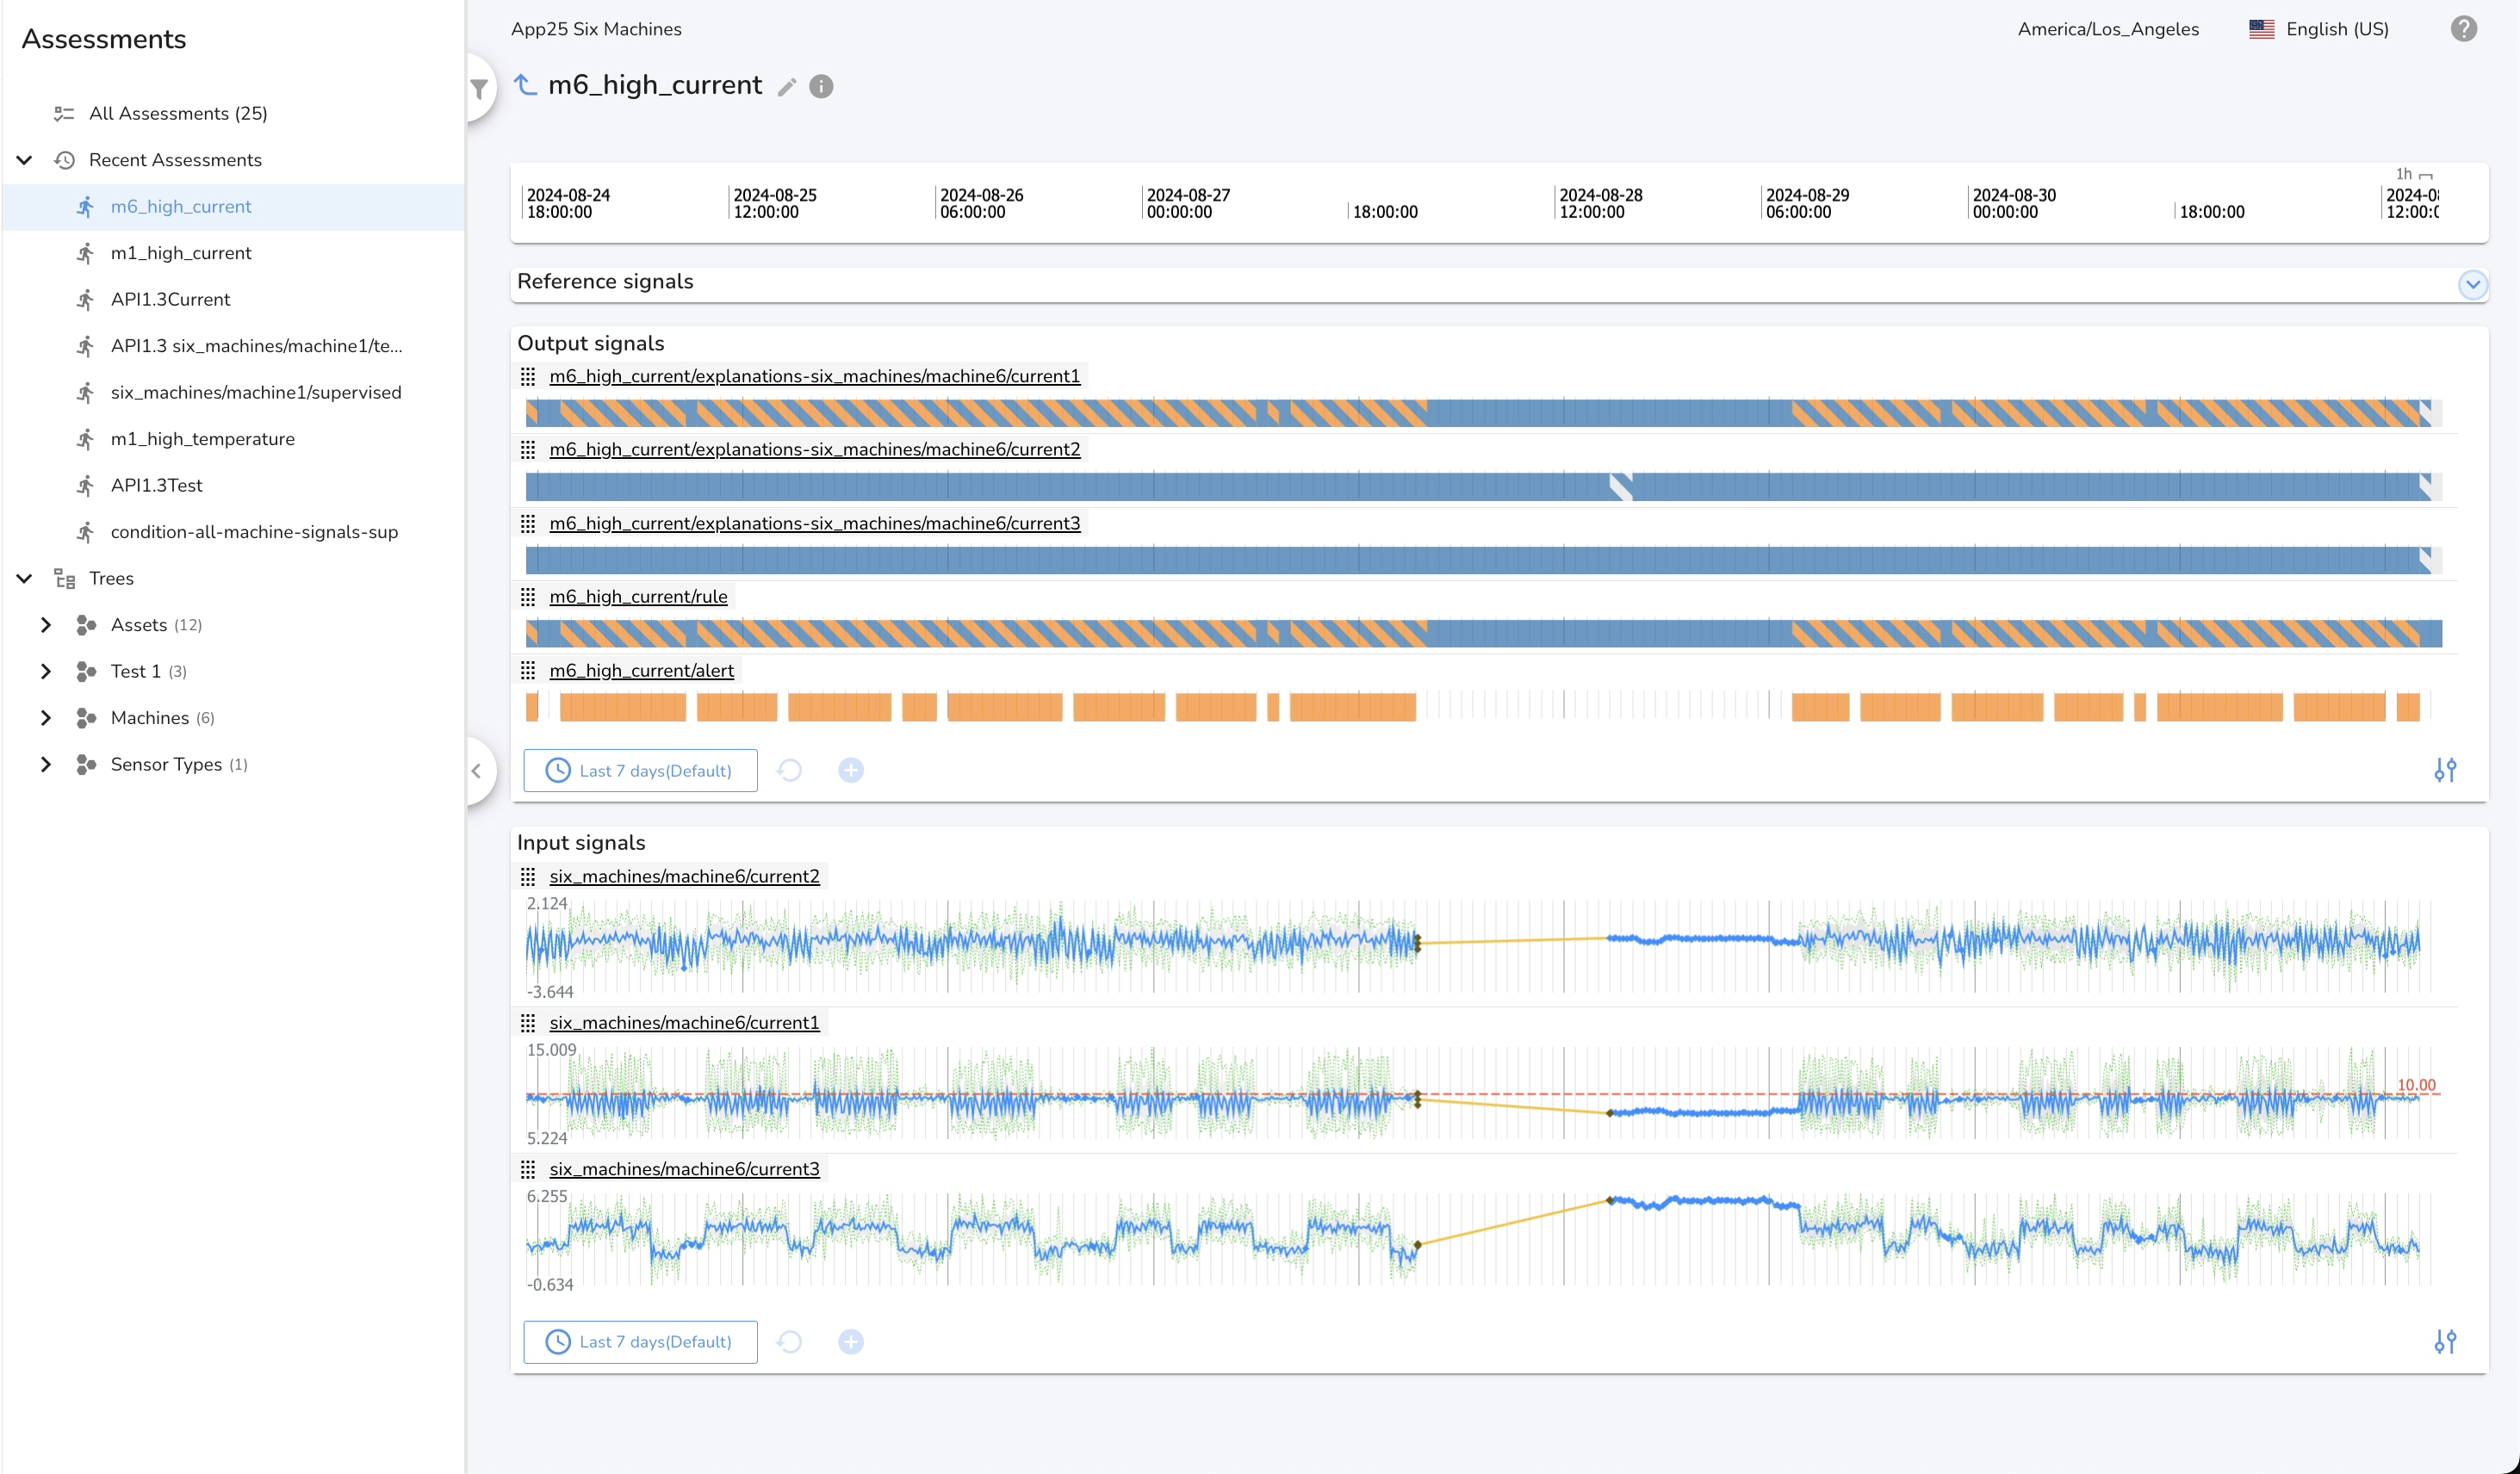
Rules Assessment
A rule assessment produces three types of output signals:
- Rule Output:
<assessment name>/rule— Indicates the evaluation result of the rule (e.g., True/False/gap). - Alert Output:
<assessment name>/alert— Indicates when an alert condition defined by the rule is met. - Explanation Output:
<assessment name>/Explanation-<signal name>— Provides explanation signals for each input signal, helping to interpret why the rule produced a particular result.
These outputs help you monitor rule status, receive alerts, and understand the reasoning behind rule evaluations.
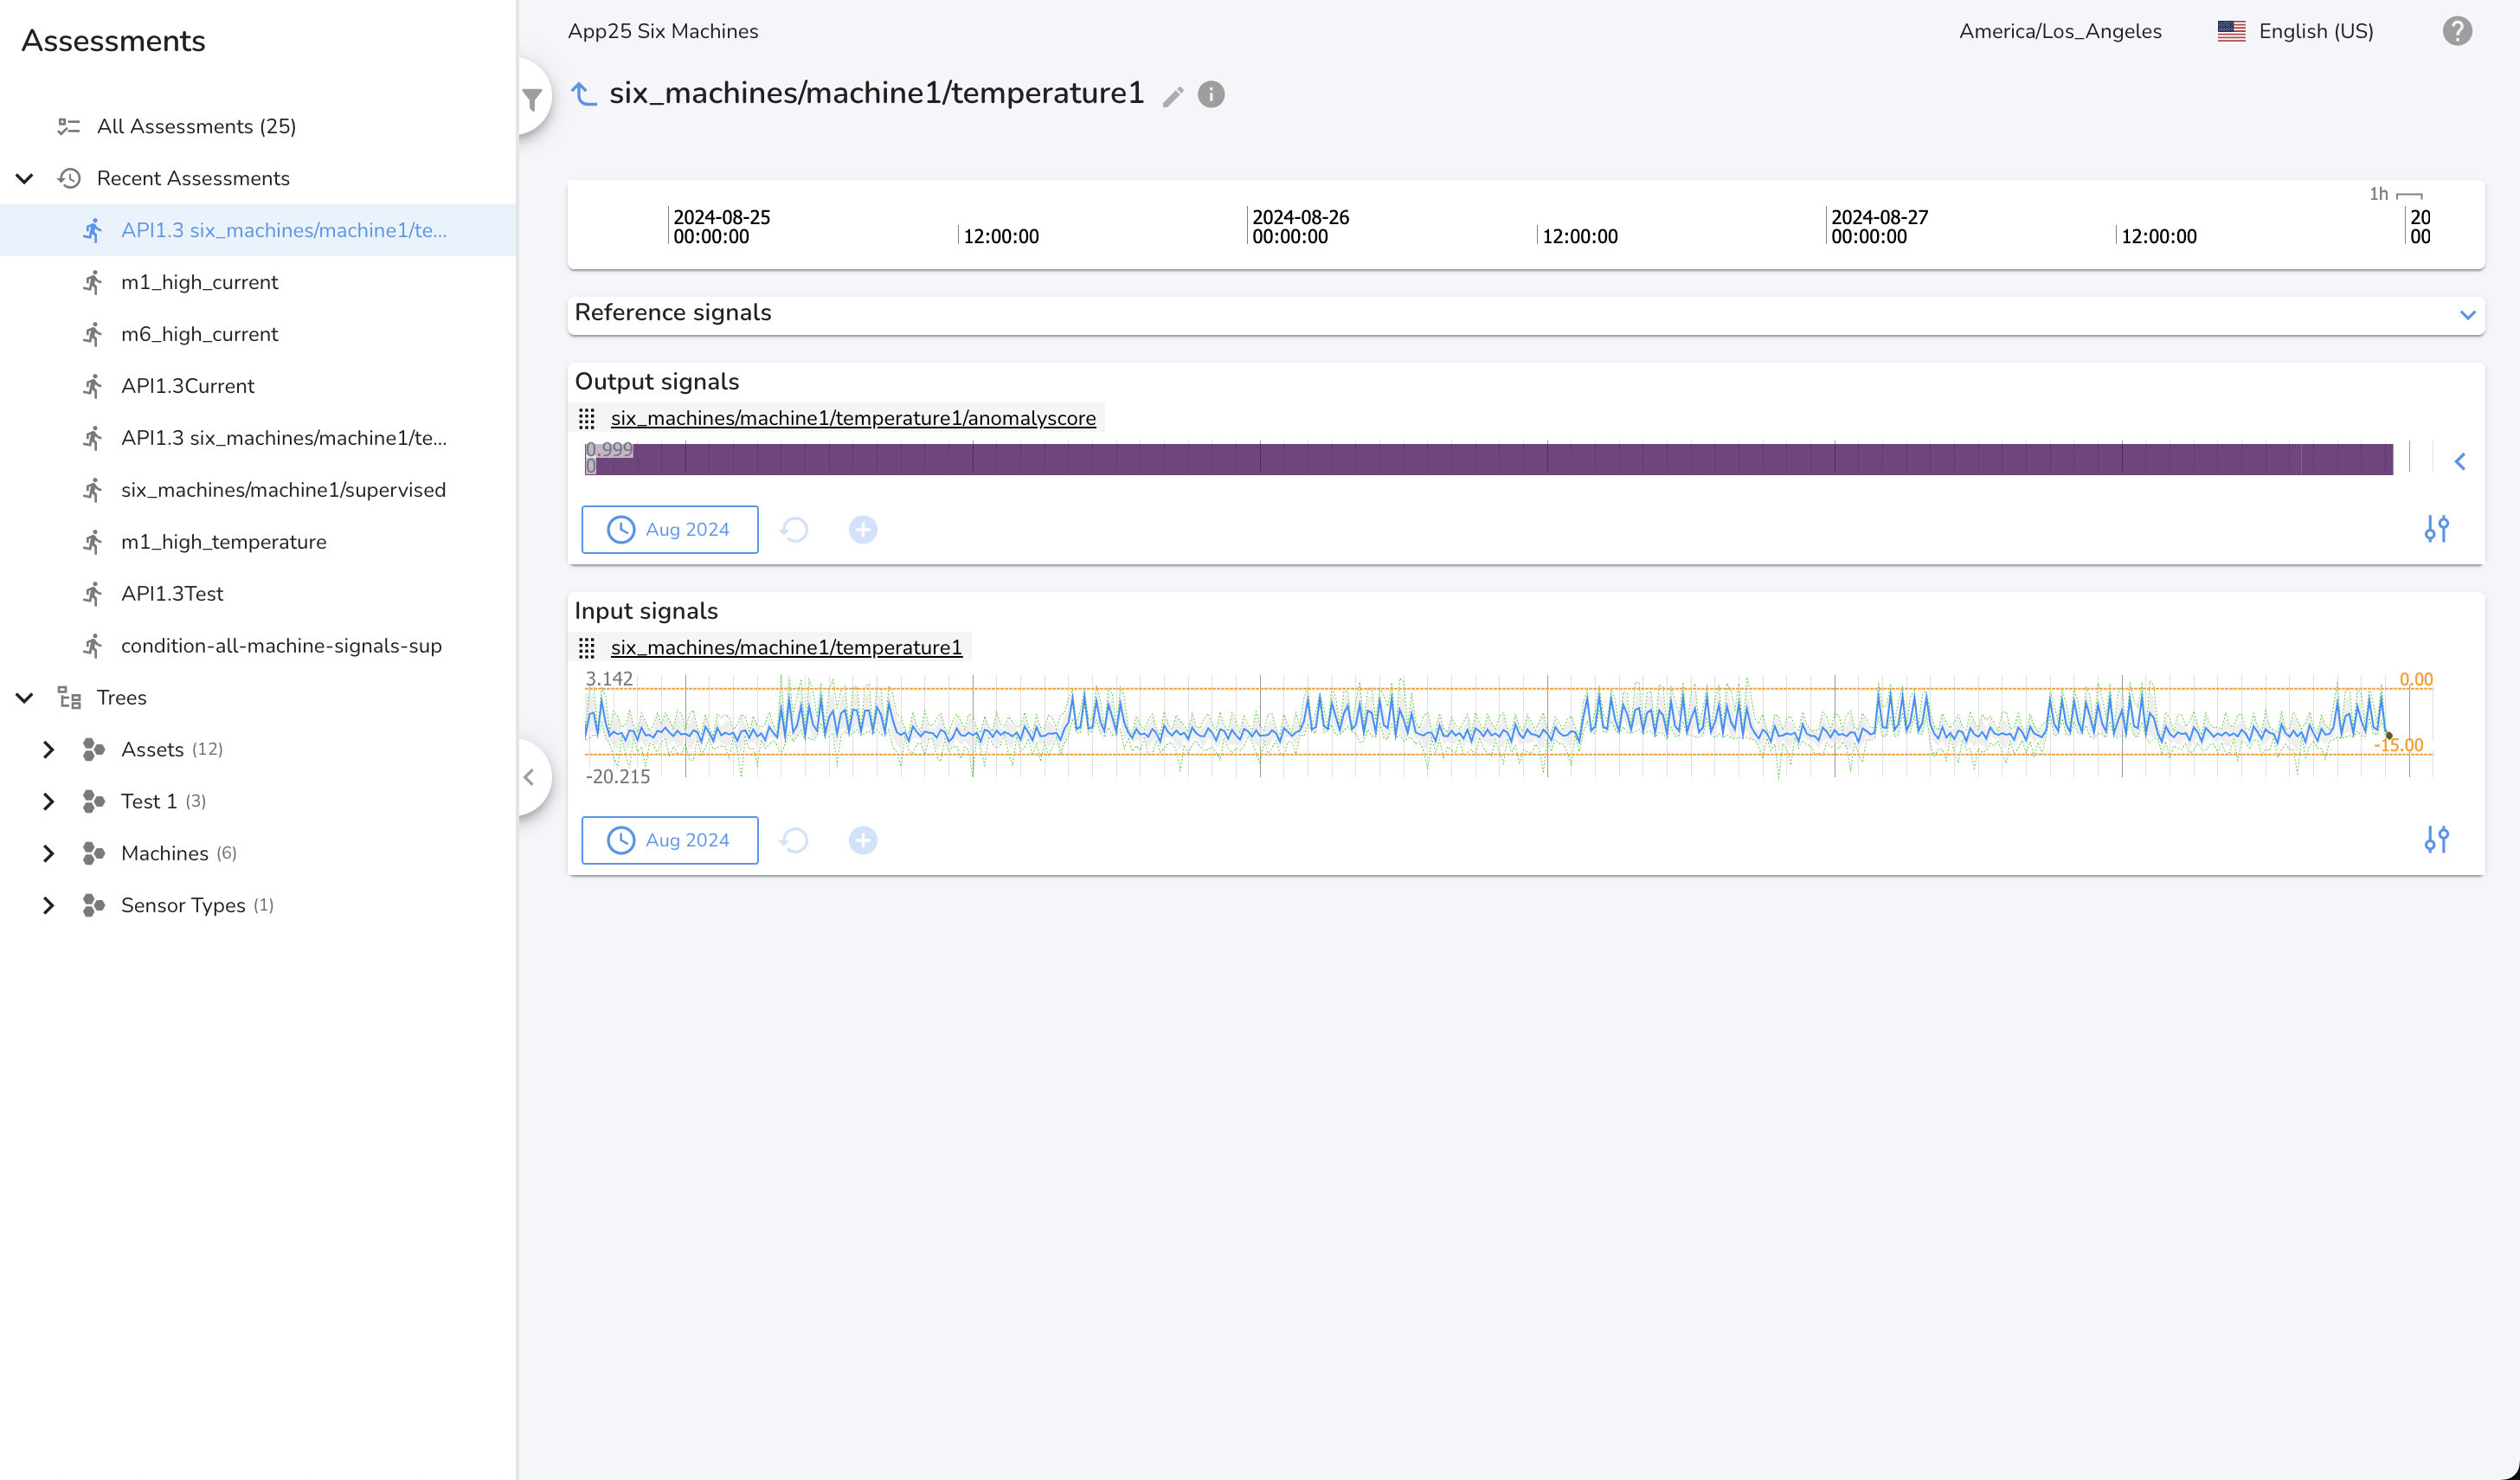
Anomalies Assessment
An anomaly assessment produces an output signal in the form <assessment name>/anomaly score, which is visualized as a heatmap.
The heatmap displays the Score, representing the degree or severity of deviation from expected behavior for the signal. The color coding highlights deviations from normal behavior:
- Purple: Normal behavior
- Green to Yellow: Rising anomaly severity
- Yellow: Significant or novel behavior needing attention
This visualization helps users quickly identify when and where signals are behaving abnormally, allowing for faster investigation and response.
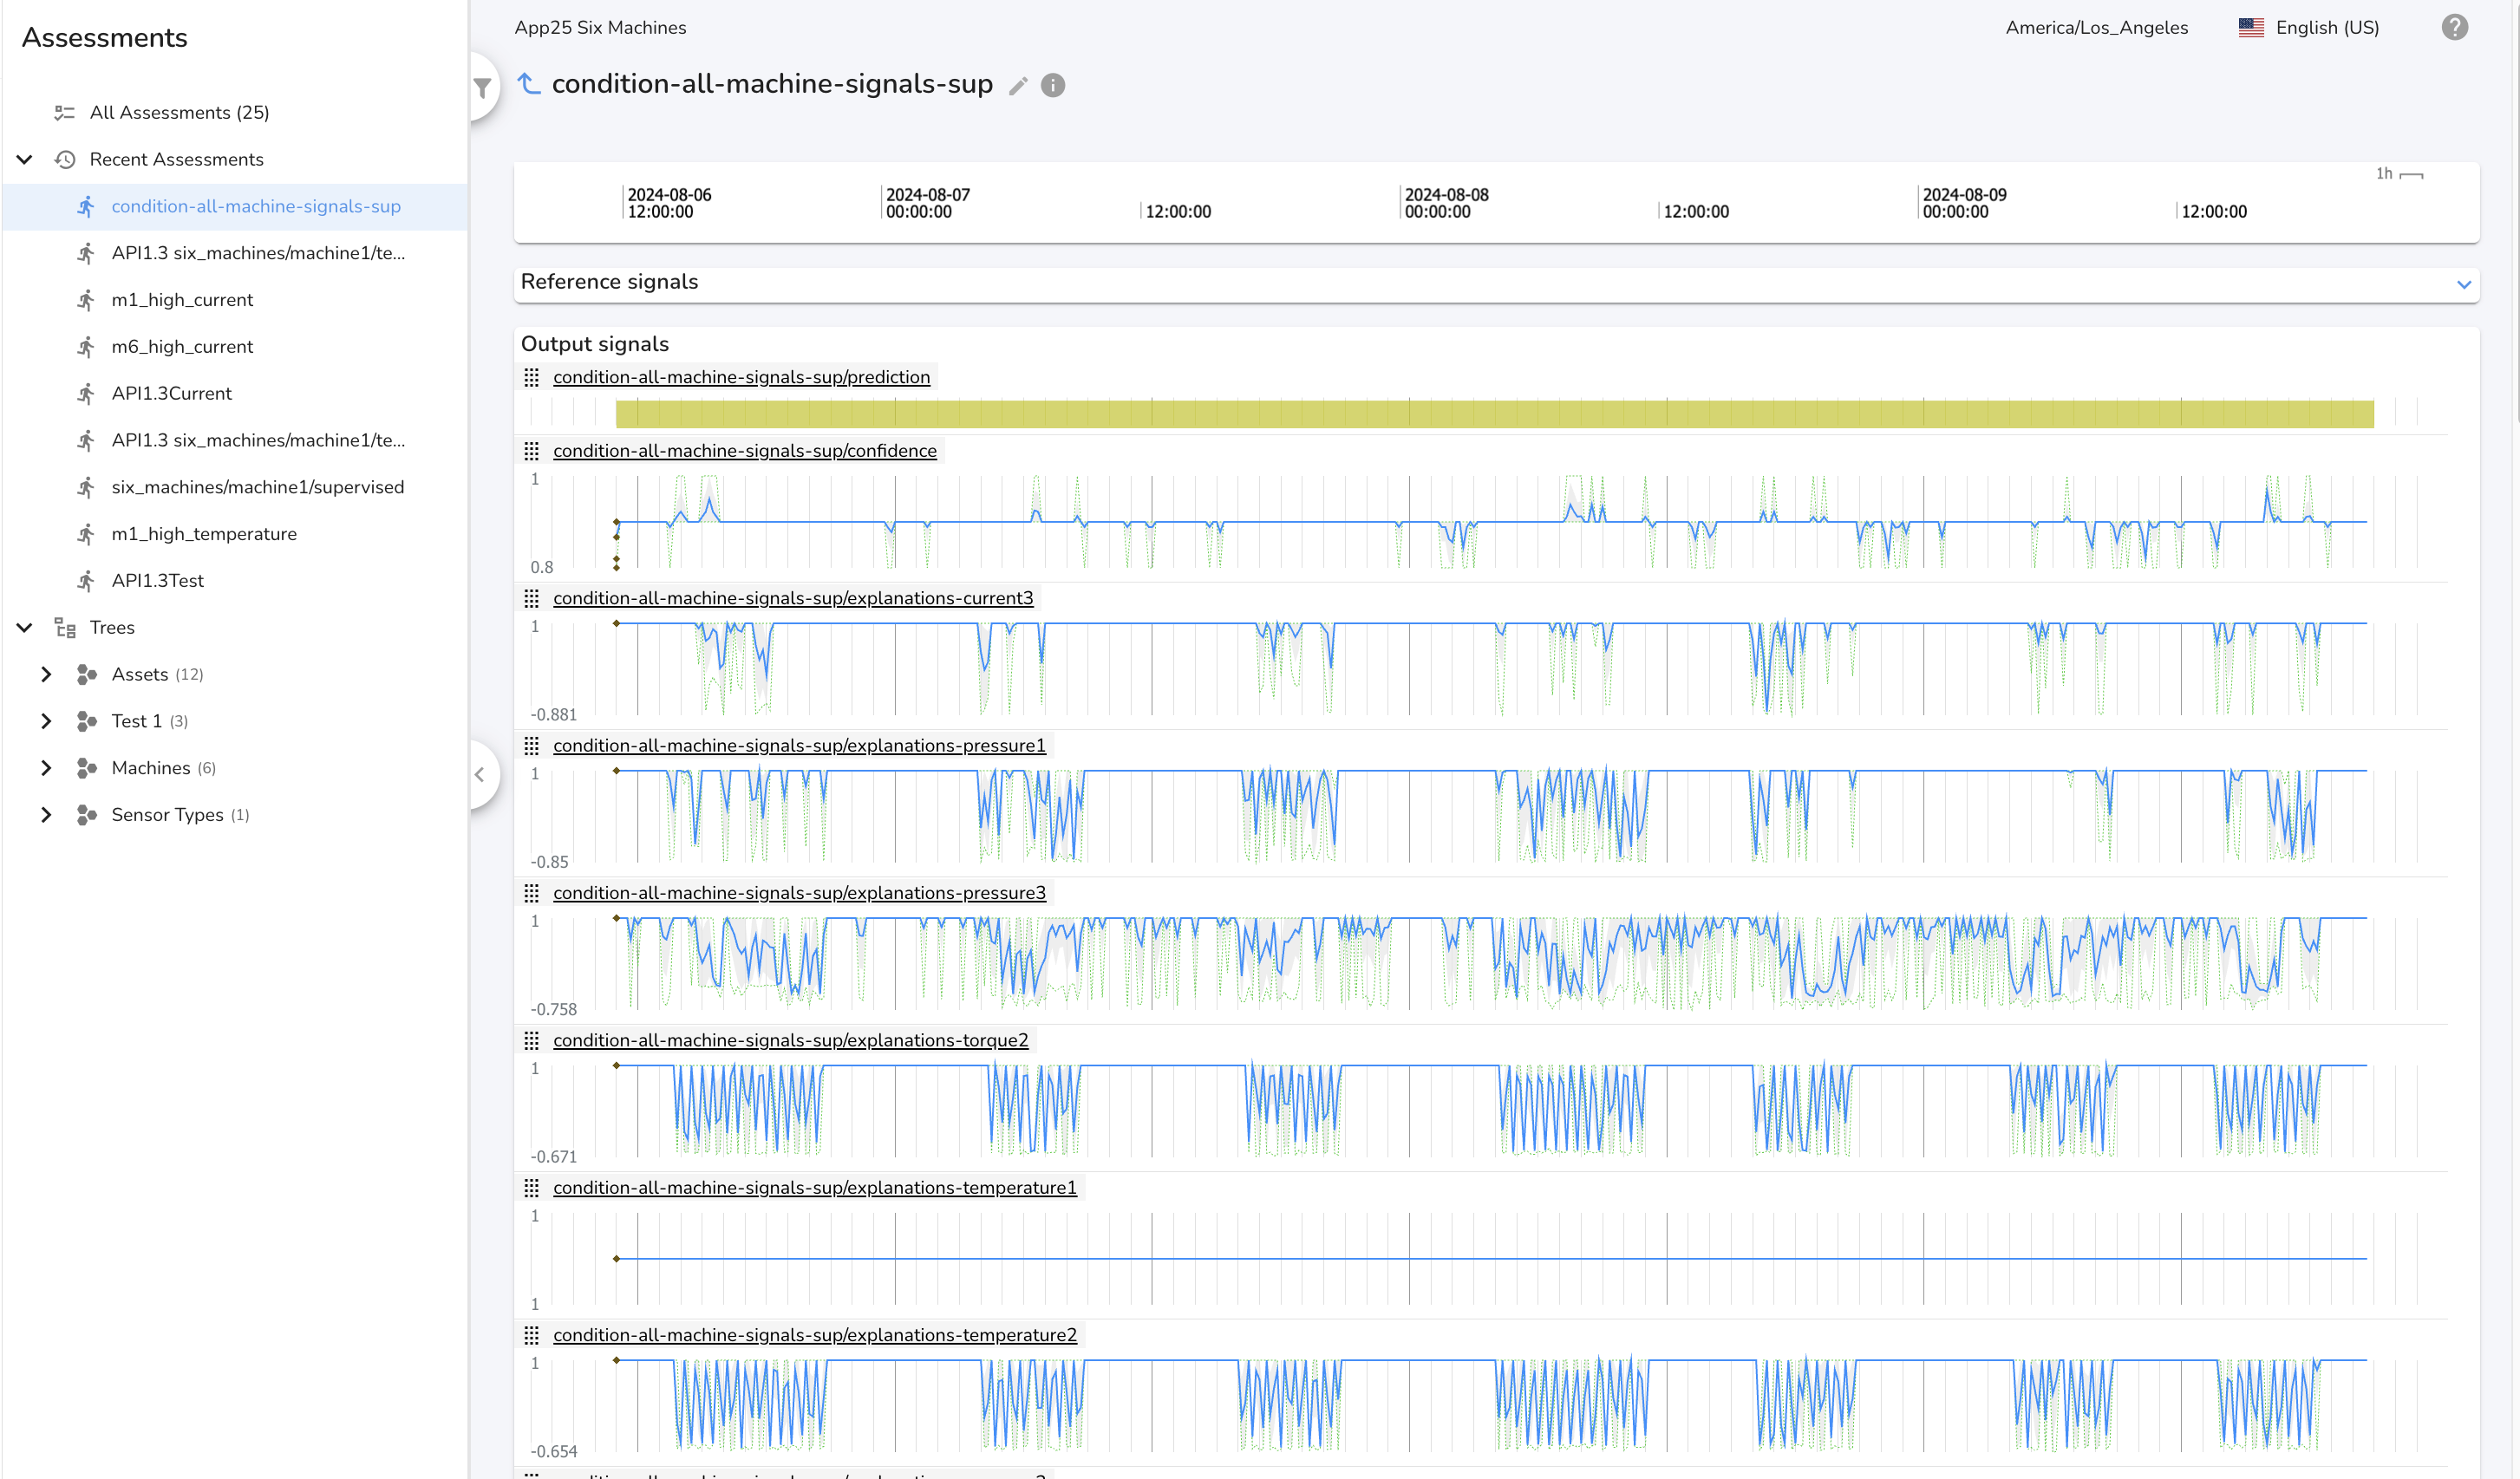
Patterns Assessment
A patterns assessment produces three types of output signals:
- Prediction:
<assessment name>/prediction— Categorical condition values over time. - Confidence:
<assessment name>/confidence— Numeric signal (0.0–1.0) indicating certainty. - Explanations:
<assessment name>/Explanation-<signal name>— Numeric signal (-1.0 to +1.0) showing the influence of each input signal on the prediction.
These outputs help you interpret the predicted condition, understand the model's certainty, and see which signals most influenced the result.
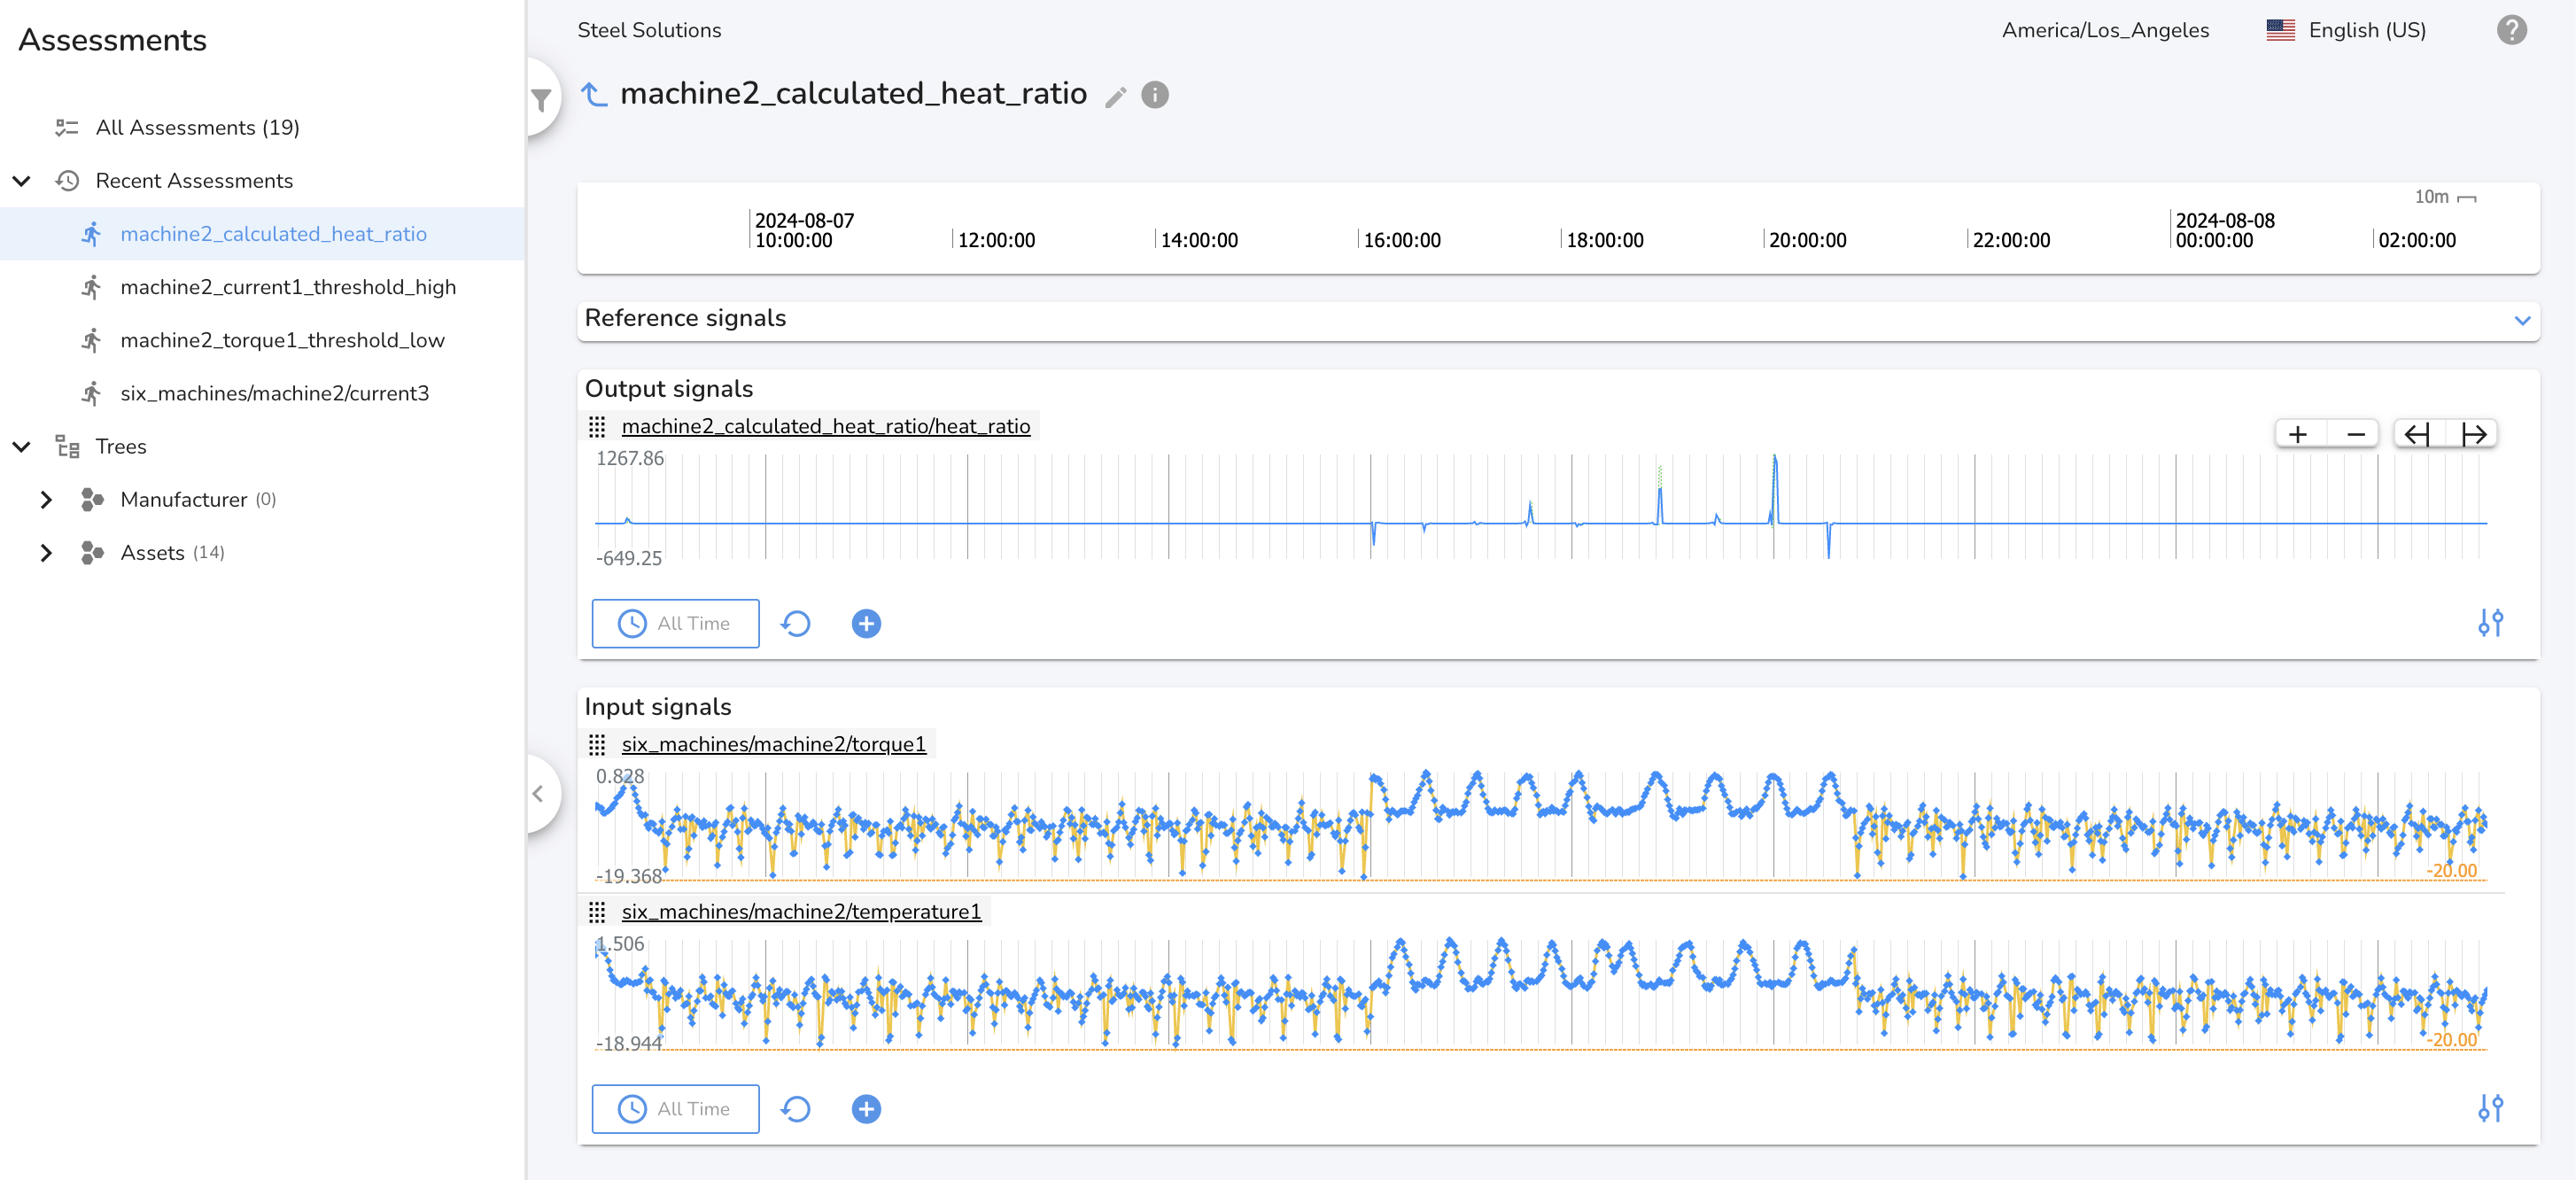
Calculations Assessment
A calculation assessment can produce any number of output signals based on the use case and the derived signal calculation.
In the following example, we are creating a derived signal for the ratio of temperature to torque. The derived signal name can be user configured and will be in the form <assessment name>/<signal name>.
Input Signals
This section contains charts for all input signals to the assessment.
Time Ranges
All sections on the page share a common time range. Zooming, panning, or using the time range manager will update all sections. If the dashboard is set to a relative time range (e.g., last 24 hours), the charts will automatically update in real time as new data is received and processed.